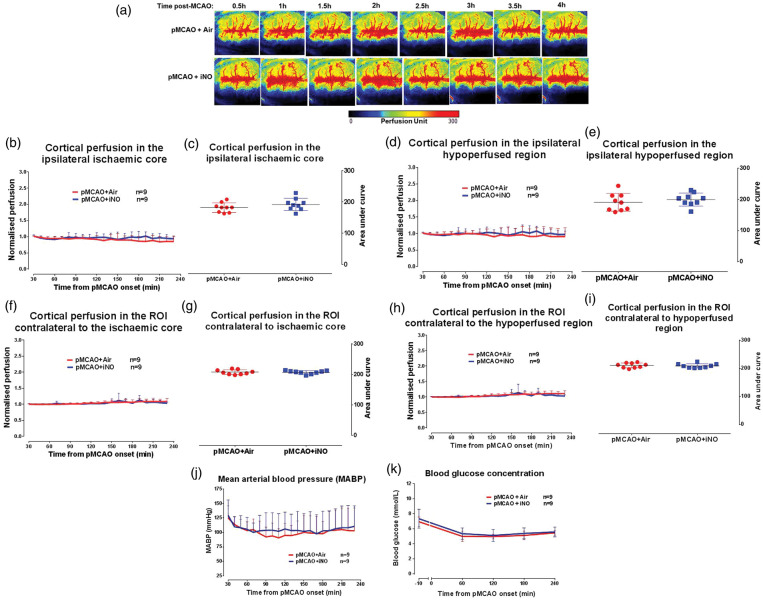
Figure 5.
Influence of iNO on cortical collateral recruitment post-MCAO. (a) Cortical blood flow map for representative rat per group over the time course of ischaemia. (b) Cortical blood flow, normalised to the respective 10 min average at baseline, in the ipsilateral ischaemic core ROI. (c) Area under the curve of cortical perfusion in the ipsilateral ischaemic core ROI over the time course of ischaemia (0.5–4 h). (d) Cortical blood flow, normalised to the respective 10 min average at baseline, in the ipsilateral hypoperfused ROI. (e) Area under the curve for cortical perfusion in the ipsilateral hypoperfused ROI. (f) Cortical perfusion, normalised to the respective 10 min average at baseline, in the ROI contralateral to ischaemic core. (g) Area under the curve of cortical perfusion for ROI contralateral to ischaemic core. (h) Cortical perfusion, normalised to the respective 10 min average at baseline, in the ROI contralateral to hypoperfused ROI. (i) Area under the curve of cortical perfusion for ROI contralateral to hypoperfused ROI. (j) MABP over the time course of ischaemia in air and iNO groups. (k) Blood glucose concentration 10 min prior to and during the time course of ischaemia. Area under the curve data for cortical perfusion presented as mean ± SD, other data presented as mean + SD.

