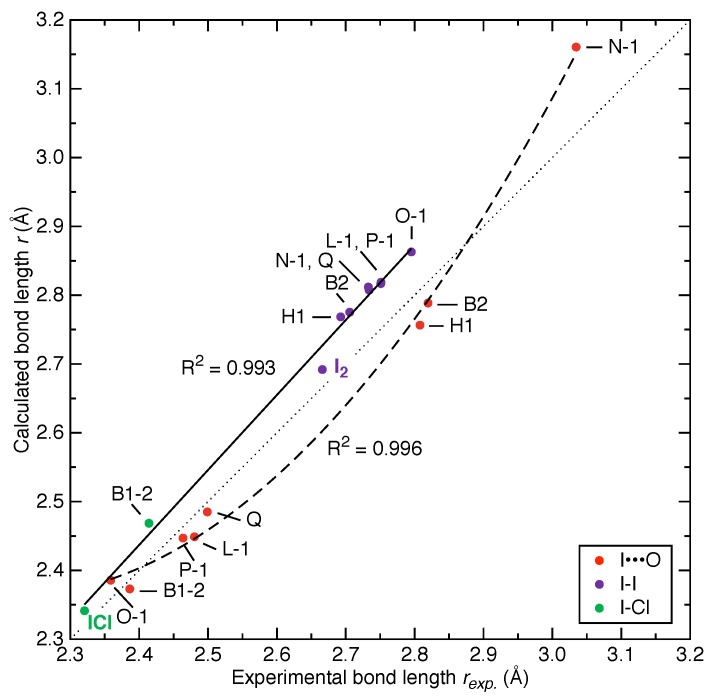
Figure 2.
Comparison between calculated versus the experimental bond lengths in 8 crystal structures. The diagonal dotted line is , i.e., reflecting 100% agreement between experimental and calculated values. Purple and green dots represent I-I and I-Cl covalent bonds, respectively. The diiodine (I) and iodine monochloride (ICl) molecules in gas phase are also included for comparison. The solid black line shows a linear fit () for I-I and I-Cl covalent bonds altogether. The red dots representing I⋯O halogen bonds are best fitted with a quadratic curve () shown as the dashed black line.

