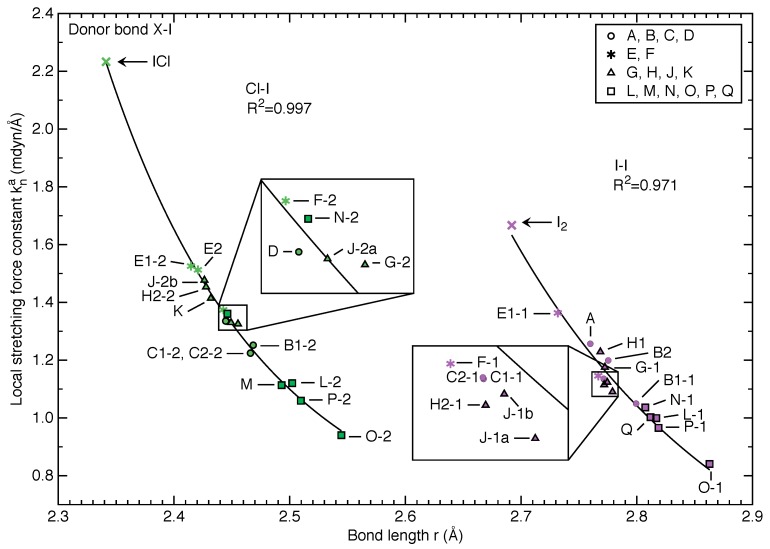
Figure 3.
Relationship between local stretching force constant and bond length r for Cl-I (green) and I-I (purple) covalent bonds, respectively. Data points are shown with at least 4 shapes based on the acceptor molecule type, see Figure 1. Power functions in the form of were employed in fitting the data points for Cl-I and I-I bonds separately.

