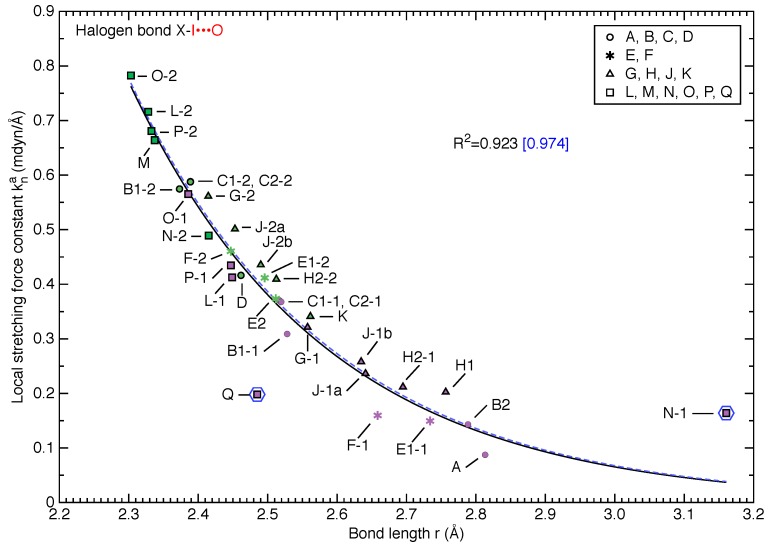
Figure 4.
Relationship between local stretching force constant and bond length r for Cl-I⋯O (green) and I-I⋯O (purple) halogen bonds, respectively. Data points are shown with 4 shapes based on the acceptor molecule type, see Figure 1. An exponential function in the form of was used to fit all 34 data points with . Two data points are identified as outliers (encircled by blue hexagons) and is obtained for fitting the remaining 32 data points. The blue dashed curve shows the updated fitting function excluding two outliers.

