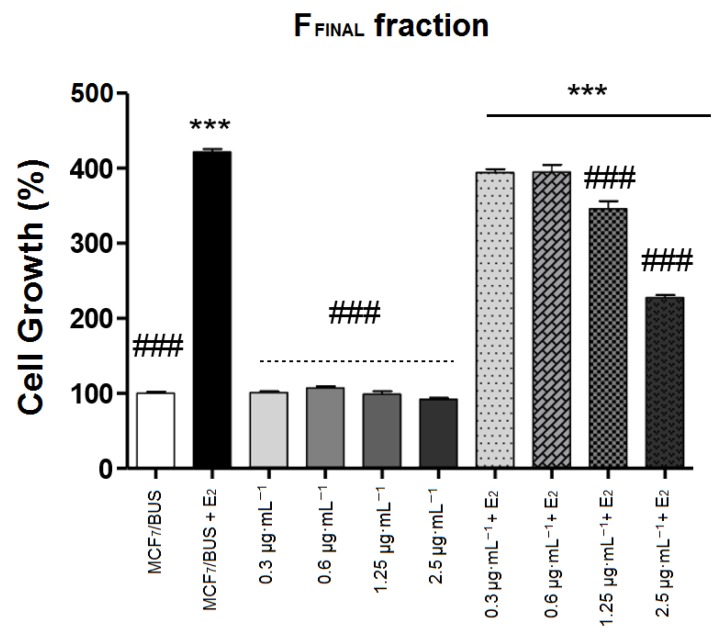
Figure 3.
MCF-7 BUS cells treated for 144 h with the FFINAL fraction at concentrations 0.3; 0.6; 1.25 and 2.5 μg·mL−1. Results expressed as mean ± standard deviation. Statistical analysis by One-way ANOVA followed by Tukey’s Test ***, ### p < 0.001 (ANOVA). * Statistical difference in relation to control of cells without estradiol. # statistical difference compared to cells control with estradiol.

