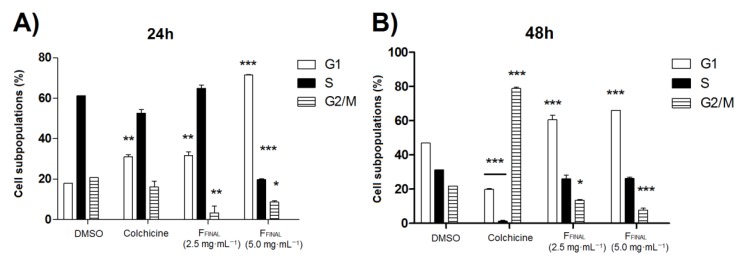
Figure 4.
Cell population, expressed in percentage for each phase of cell cycle G1, S and G2, after (A) 24 h-treatment and (B) 48 h-treatment with vehicle, colchicine (0.25 μg·mL−1) or FFINAL fraction (2.5 and 5.0 μg·mL−1). Data are derived from an experiment performed; standard deviations are indicated by error bars. Results expressed as mean ± standard deviation. Statistical analysis by One-way ANOVA followed by Tukey’s Test * p < 0.05, ** p < 0.01 and *** p < 0.001 (ANOVA). * Statistical difference compared to cells control.

