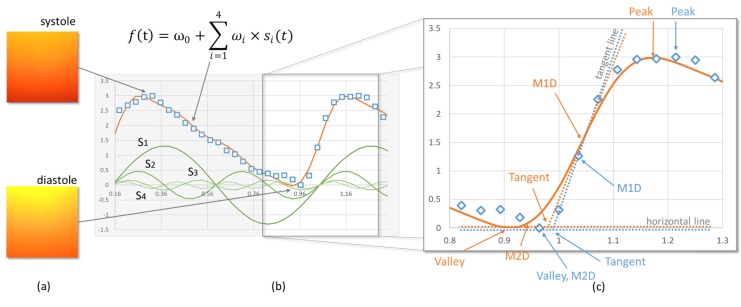
Figure 2.
(a) Illustration of two frames of the video of a left fingertip captured using a smartphone camera (Mi 8 SE, Xiaomi, China). The frame captured during the systole phase is darker and converted to a larger value by photoplethysmography (PPG); the frame captured during the diastole phase is lighter and converted to a smaller value by PPG. (b) Illustration of using the sum of the four sinusoidal functions to fit the collected samples from a 19-year-old female. (c) Illustration of five types of fiducial points (Peak, Valley, Tangent, maximum first derivative (M1D), and maximum secondary derivative (M2D)) determined with both raw data points (blue) and the fitted model (orange).

