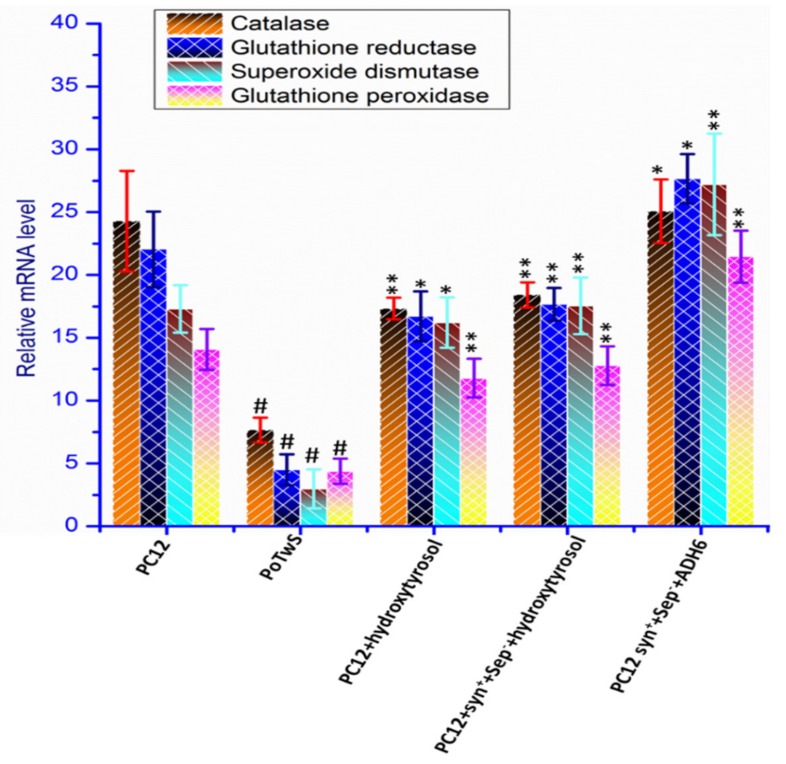
Figure 5.
Comparative qPCR analysis. The transcription level of CAT, GSH, SOD, and GPx was determined in PC12 cells, PoTwS cells, and the PC12+hydroxytyrosol, PC12+syn++sep−+hydroxytyrosol, and PC12+syn++sep−+ADH6 cell lines. The maximum improvement in the transcription level of CAT, GSH, SOD, and GPx was observed in the PC12+syn++sep−+ADH6 cell line compared to PoTwS cells. The description of each cell line is given in Supplementary Table S3. Data are mean and S.E. values from three independent experiments (n = 3). # p < 0.01, relative to PC12 (control cells). * p < 0.05 and ** p < 0.01, relative to the cells treated only with salsolinol.

