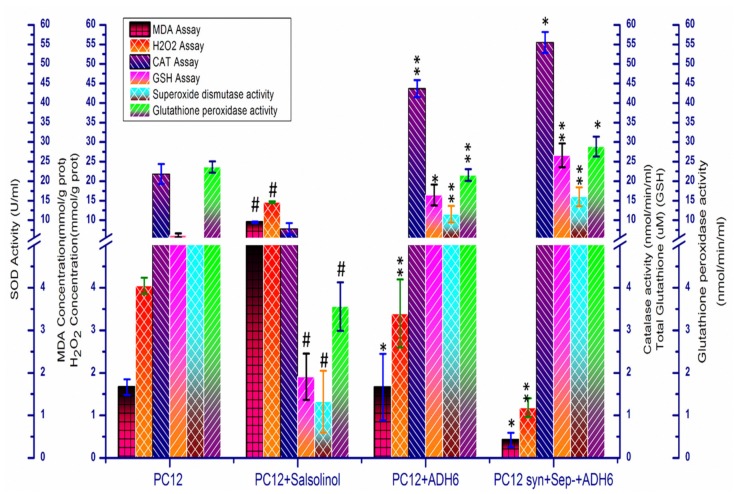
Figure 8.
MDA assay, H2O2 assay, CAT assay, GSH assay, superoxide dismutase activity assay, and glutathione peroxidase activity assay of the PC12+syn++sep−+ADH6+ cell line. The levels of MDA and H2O2 were decreased in PC12+syn++sep−+ADH6+ cells compared to PoTwS cells. The activity of catalase and glutathione reductase activity, superoxide dismutase activity, and glutathione peroxidase was increased in the PC12-ADH6+ and PC12+syn++sep−+ADH6+ cell lines compared to PoTwS cells. Error bars represent the standard deviation of biological triplicates. The description of each cell line is given in Supplementary Table S3). Data are mean and S.E. values from three independent experiments (n = 3). # p < 0.05, relative to control cells (PC12 cells). * p < 0.05 and ** p < 0.01, relative to the cells treated only with salsolinol.

