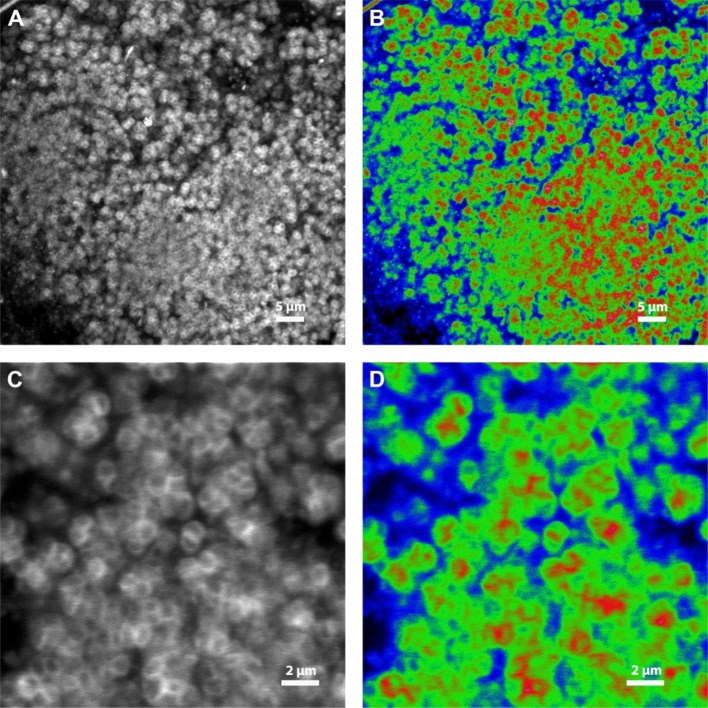
Figure 3.
Confocal laser scanning microscopy of Heparin Red, bound to components in the fully hydrated, intact anammox granule. (A) and (C) are greyscale images of the fluorescent signal. (A) and (B) represent an image series of 45 optical sections at 0.17 μm step size shown as maximum intensity projection, (C) and (D) represent a single image. (B) and (D) are the images of (A) and (C), respectively, converted to color images with three pixel intensities: red = binding of Heparin Red, green = quenched signal, implying high negative charge density, and blue = no binding of Heparin Red (see detailed explanation in the Results section).

