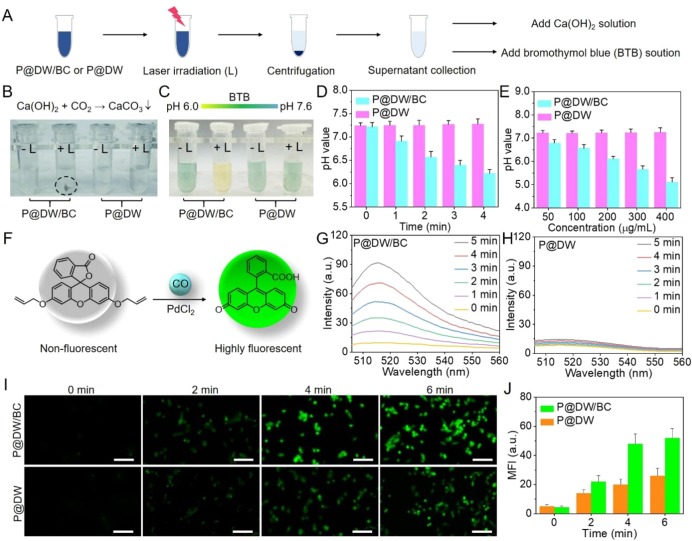
Figure 3.
(A) Schematic of CO2 detection via Ca(OH)2 and pH change evaluation via BTB. (B) Chemical reaction of CaCO3 formation (upper) and photographs of the samples after centrifugation. (C) The color change of BTB solution with pH change (up) and photographs of supernatants after the addition of BTB solution. (D) pH values of P@DW/BC and P@DW solutions (200 μg mL–1) during 808 nm laser irradiation (1 W cm–2). (E) pH values of P@DW/BC and P@DW solutions (50, 100, 200, 300, and 400 μg mL–1) after 4 min of 808 nm laser irradiation (1 W cm–2). (F) Schematic illustration of fluorescent detection of CO by the CO probe. Fluorescent spectra changes of (G) P@DW/BC and (H) P@DW solutions (100 μg mL–1) together with CO probe and PdCl2 under 808 nm laser irradiation (1 W cm–2). (I) Fluorescent imaging of CO in CT26 cells after the treatment of P@DW/BC or P@DW (100 μg mL–1) upon laser irradiation (1 W cm–2). (J) Changes of the intracellular fluorescence intensity in (I).

