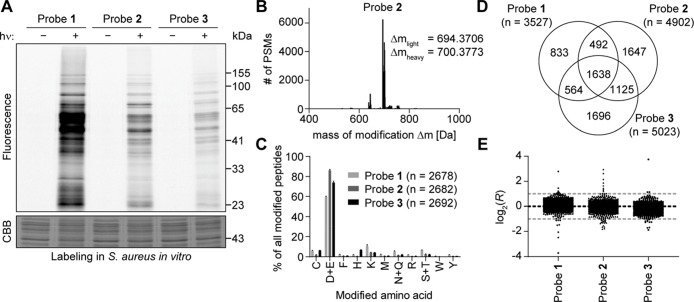
Figure 2.
Light-activatable 2,5-disubstituted tetrazoles allow global monitoring of aspartates and glutamates in the S. aureus proteome in vitro with high specificity. (A) Gel-based analysis of labeling with probes 1–3. S. aureus lysate was treated with 100 μM of the indicated probe, incubated for 30 min, irradiated with light (λ = 280–315 nm) for 10 min, and labeled with TAMRA-azide using CuAAC. Controls were performed without irradiation. Gel-based analysis was performed with in-gel fluorescence scanning and staining using Coomassie Brilliant Blue (CBB). (B) Analysis of the mass of modification on tryptic peptides after labeling of S. aureus lysate with 100 μM probe 2. MSFragger software35 was used to determine, which masses of modification occur in the proteomic samples labeled with probe 2 after light activation and CuAAC to the light and heavy isoDTB tags. Expected masses of modification for tryptic peptides labeled with 2 according to the reactivity shown in Figure 1C and additionally modified with light or heavy isoDTB tag, respectively, are 694.3663 and 700.3738 Da. PSM: peptide-spectrum match. (C) Analysis of the amino acid specificity of the probes. Proteomes labeled with the indicated probe after light activation and modified by CuAAC with the light and heavy isoDTB tags were analyzed with MaxQuant software36 allowing the modification on any potentially nucleophilic amino acid. Peptides were included in the analysis if the localization probability for a single residue was more than 75%. Data shows the mean ± the standard deviation. The total number of identified PSMs is given in parentheses. (D) Venn diagram of the number of quantified aspartates and glutamates with the three different probes. (E) Plot of the ratios log2(R) for aspartates and glutamates in proteomic samples, in which the heavy- and light-labeled sample were both modified with 100 μM of the indicated probe without pretreatment with an inhibitor. The expected value of log2(R) = 0 is indicated by the black line; the preferred quantification window (−1 < log2(R) < 1) is indicated by the two gray lines. Each dot represents one quantified aspartate or glutamate. All data for panels B–E originates from biologically independent duplicates of technical duplicates.

