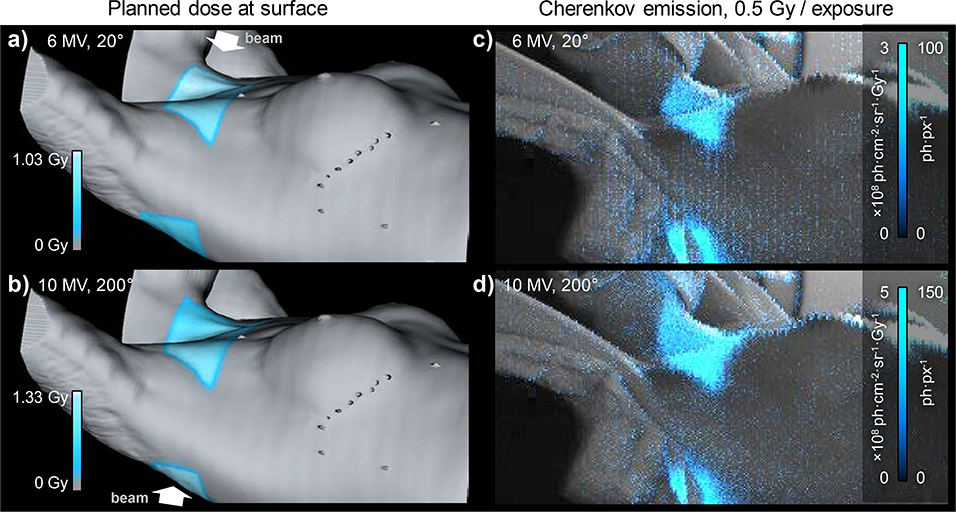
Fig. 3.
Planned surface dose profile (cyan) at the beam’s entrance (a) and exit (b), calculated from patient’s CT and TPS-based dose distribution. The surface dose corresponds an average dose value, exponentially weighted to 5 mm depth (1/e of max. intensity). c-d) Recorded Cherenkov emission (cyan) overlaid on a background image of the patient. The intensity scale reports measured photon counts (ph·px−1) and estimated radiance per unit dose (ph·cm−2·sr−1·Gy−1).

