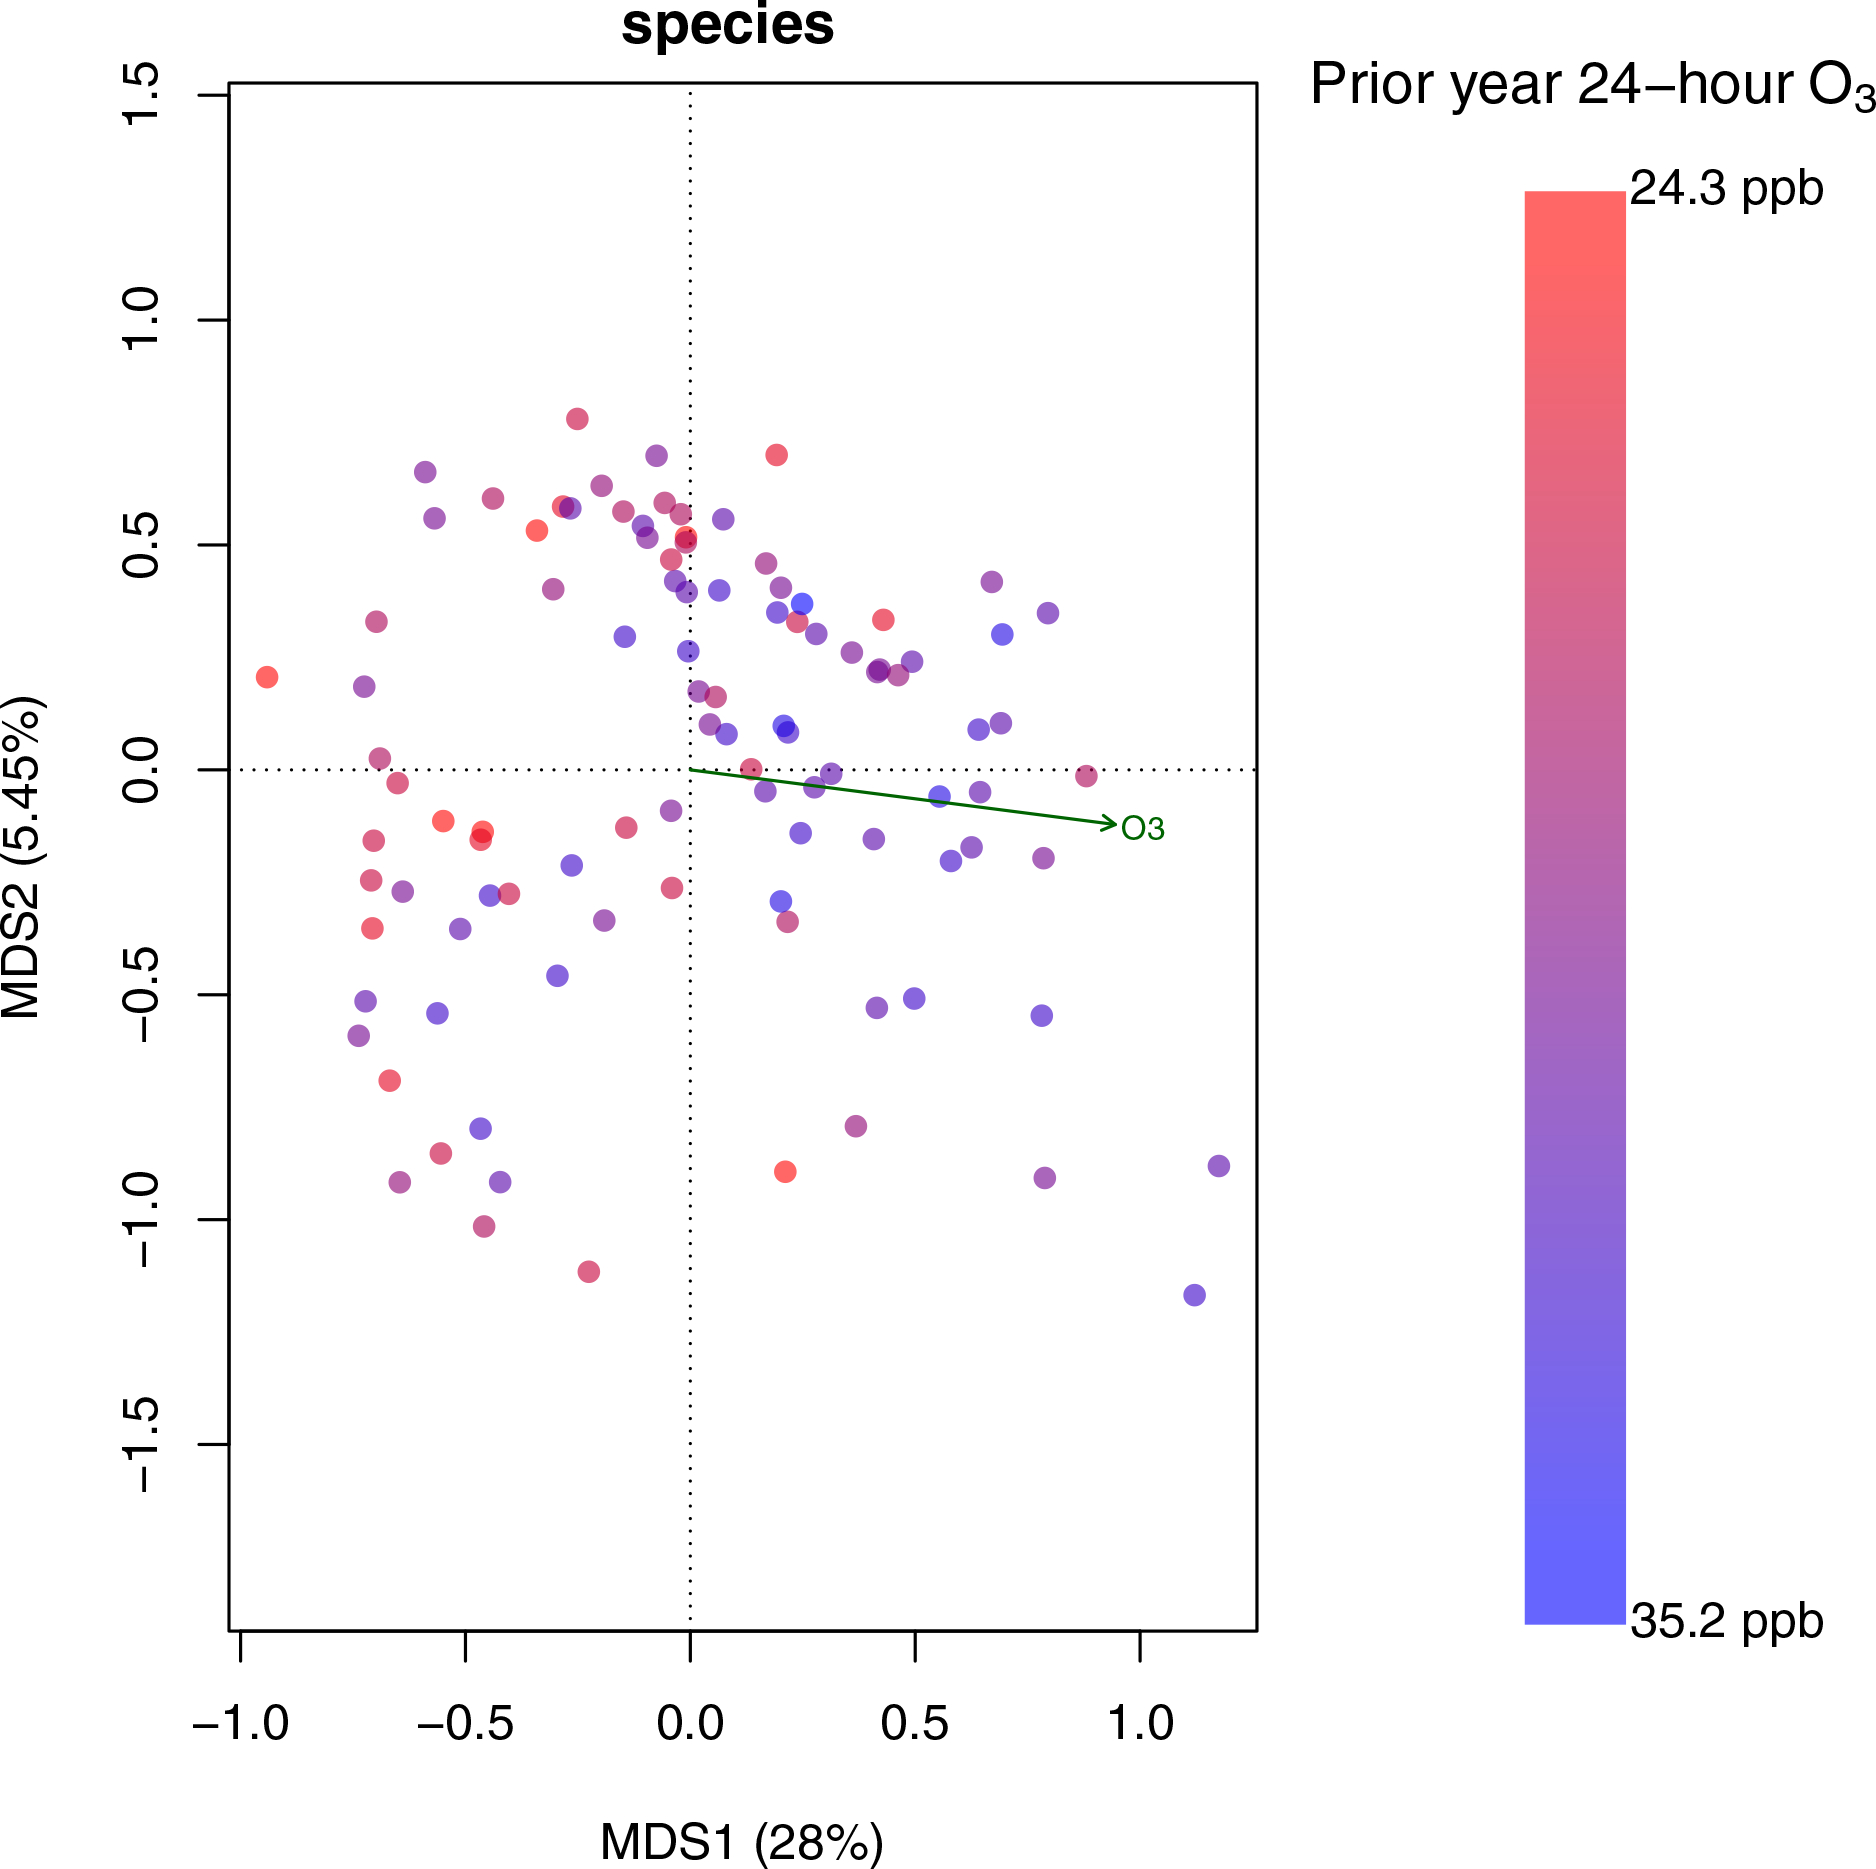
Figure 1. Exposure to O3 was Significantly Correlated with Gut Bacterial Species on the First Axis of the Multi-dimensional Scaling Analysis using Whole Genome Sequencing (WGS).

Multi-dimensional scaling on the WGS data was performed using Bray-Curtis dissimilarity at the species level. Each point represents a sample and the gradient of O3 exposure is color coded. This ordination plot shows that O3 exposure was significantly correlated with the first axis of the multi-dimensional scaling analysis, which explains 28% of variation in the data (p<0.001, R2=0.17).
