
Figure 3. Exposure to O3 was Associated with the Gut Microbiota at the Phylum Level Using Whole Genome Sequencing (WGS).
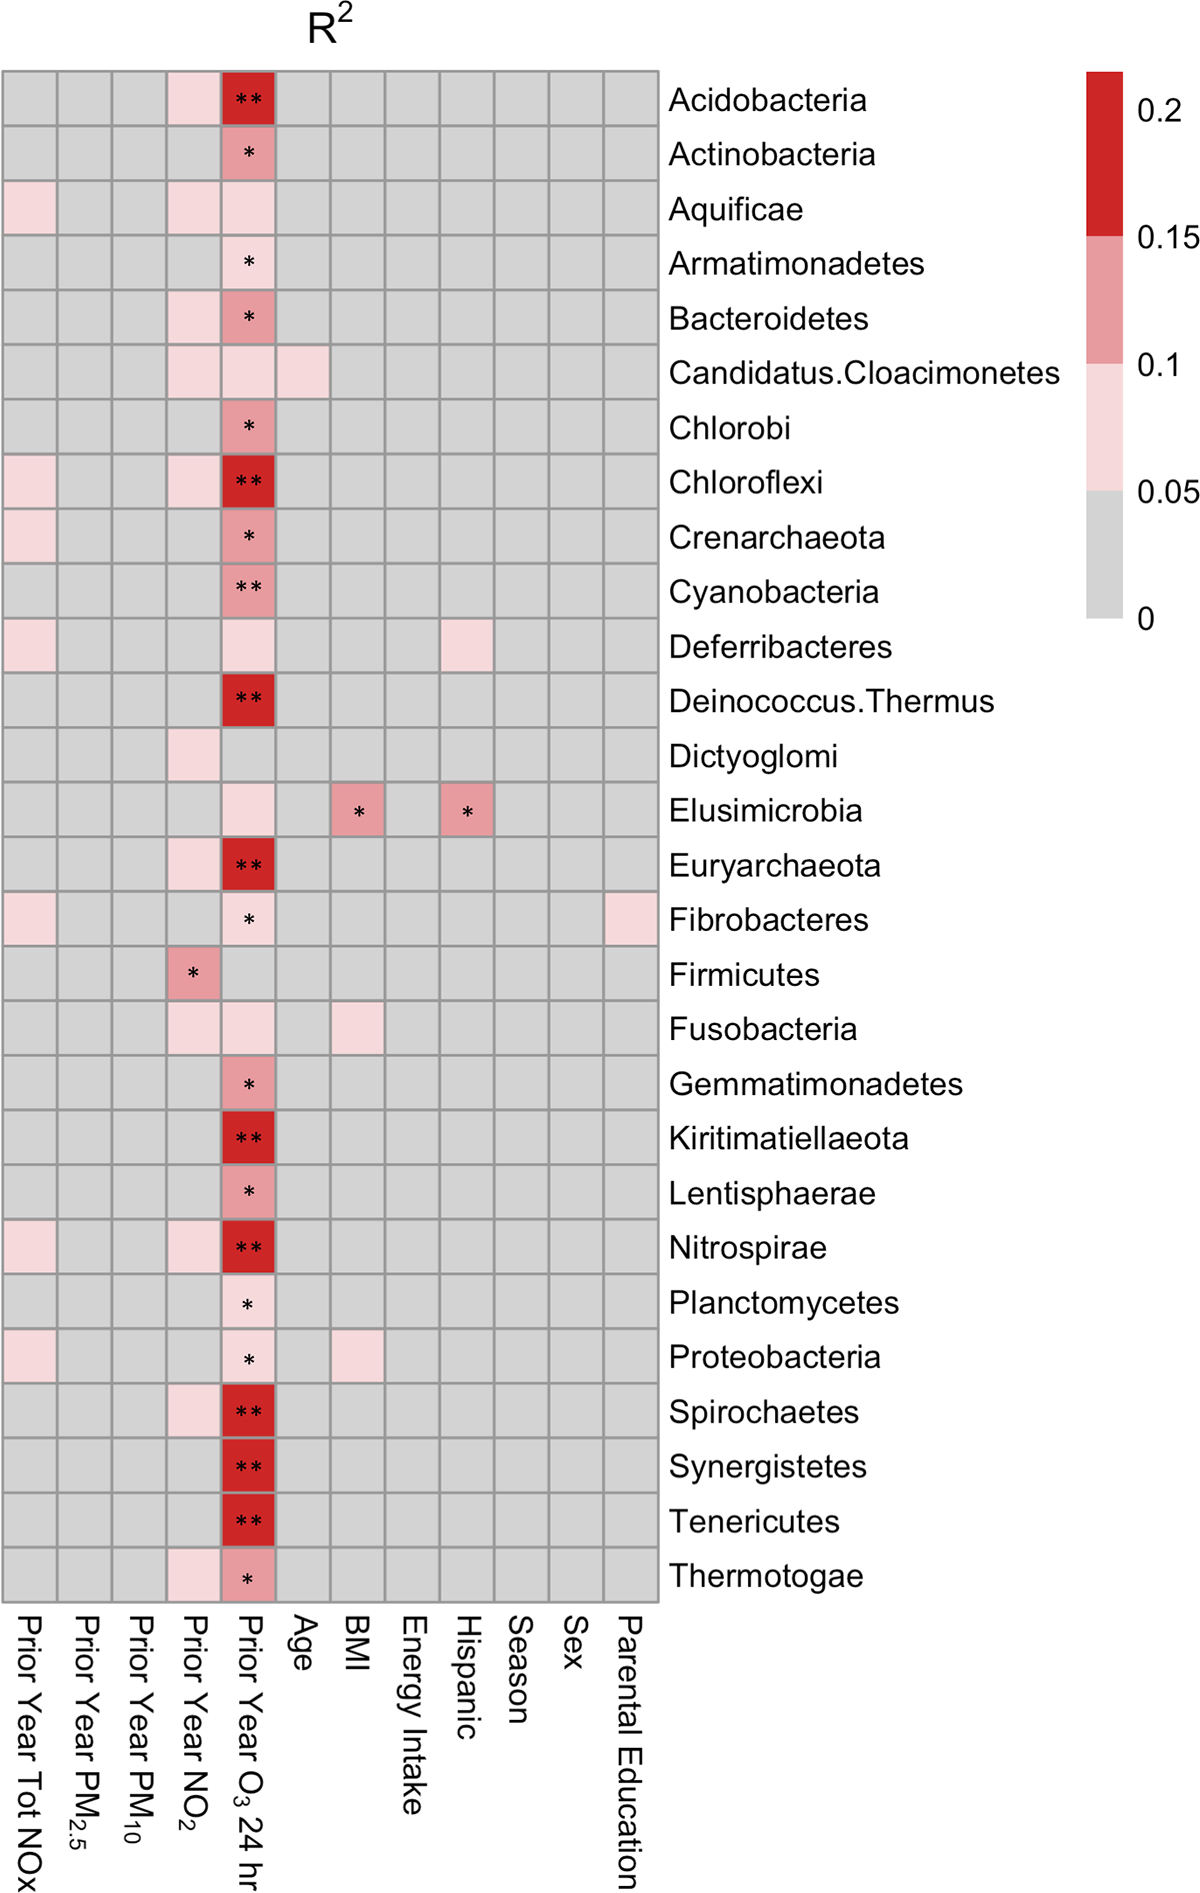
Univariate linear regression was used to determine the association between the relative abundance of gut bacterial phyla and each explanatory variable. The heatmap shows R2 values, which are indicative of the amount of variation explained by each explanatory variable in univariate regression models. ** FDR-corrected p-value < 0.01, * FDR-corrected p-value < 0.05.