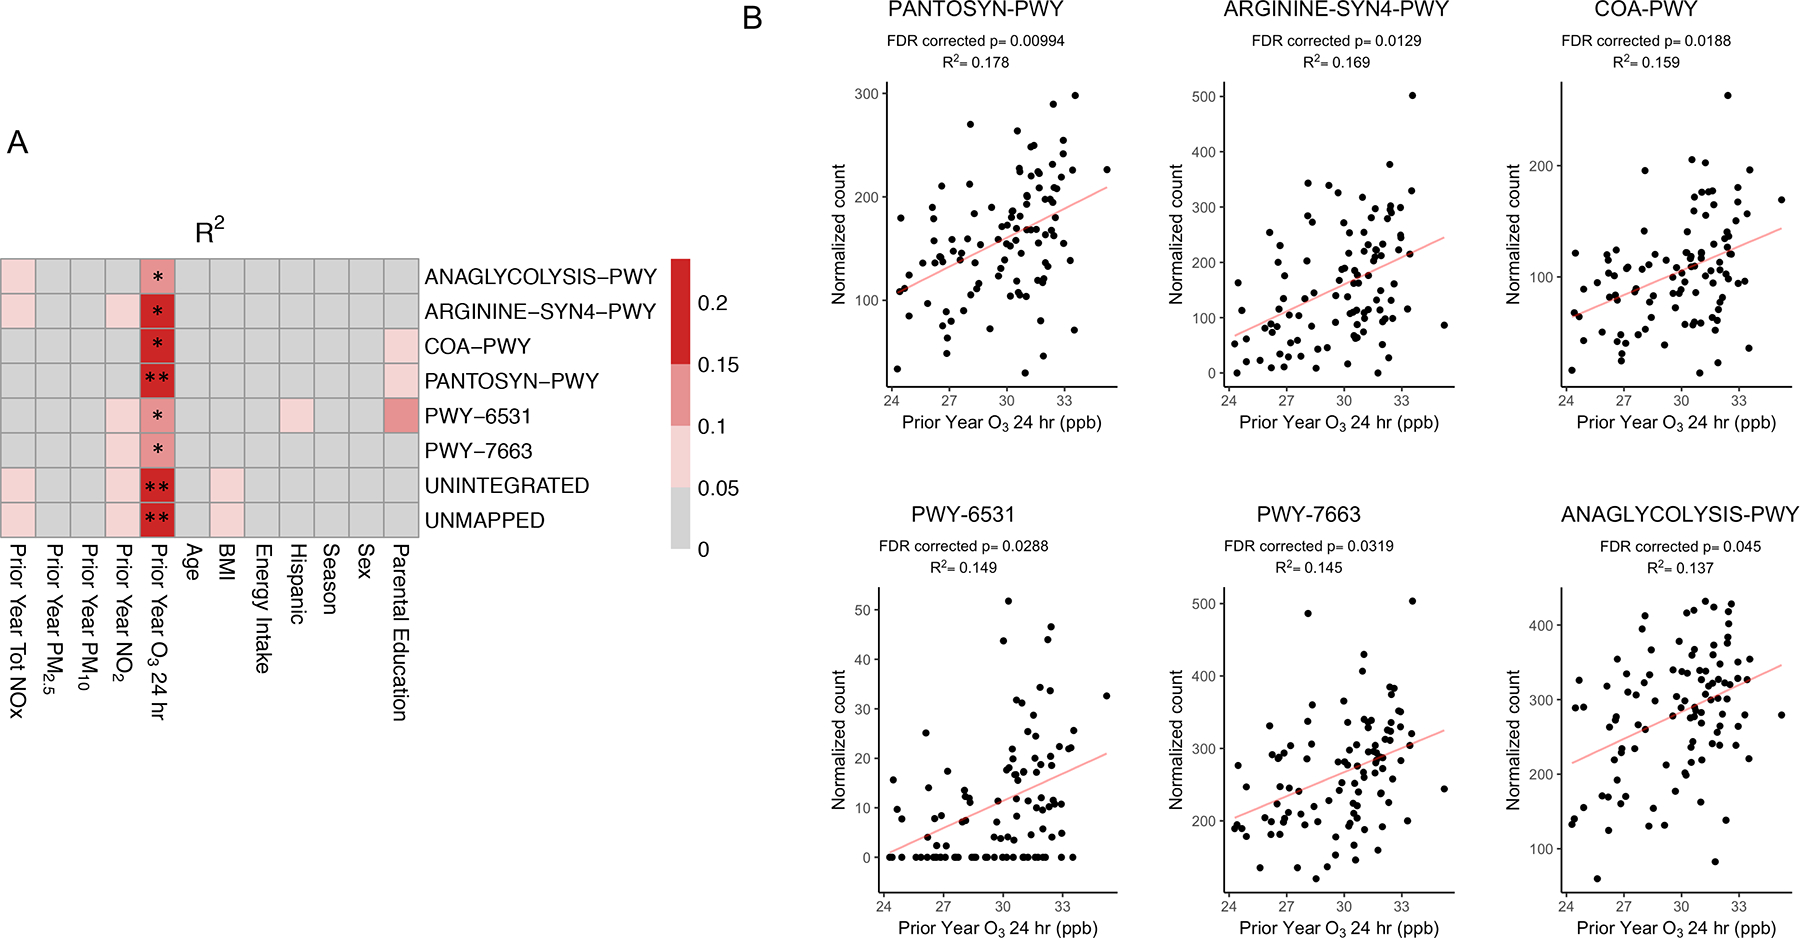
Figure 5. Exposure to O3 was Significantly Associated with Multiple Gene Pathways Using Whole Genome Sequencing (WGS).

Univariate linear regression analysis was used to determine the associations between the relative abundance of microbial gene pathways and each explanatory variable. The heatmaps shows R2 values (A), which are indicative of the amount of variation explained by each explanatory variable. ** FDR-corrected p-value < 0.01, * FDR-corrected p-value < 0.05. Scatter plots (B) show the associations between the relative abundance of six gene pathways and O3 exposure using univariate linear models with the corresponding R2 and FDR corrected p-values. PANTOSYN-PWY: pantothenate and coenzyme A biosynthesis I, ARGININE-SYN4-PWY: L-ornithine de novo biosynthesis, COA-PWY: coenzyme A biosynthesis I, PWY-6531: mannitol cycle, PWY-7663: gondoate biosynthesis (anaerobic), ANAGLYCOLYSIS-PWY: glycolysis III (from glucose). Pathway abundance is normalized to copies per million (cpm).
