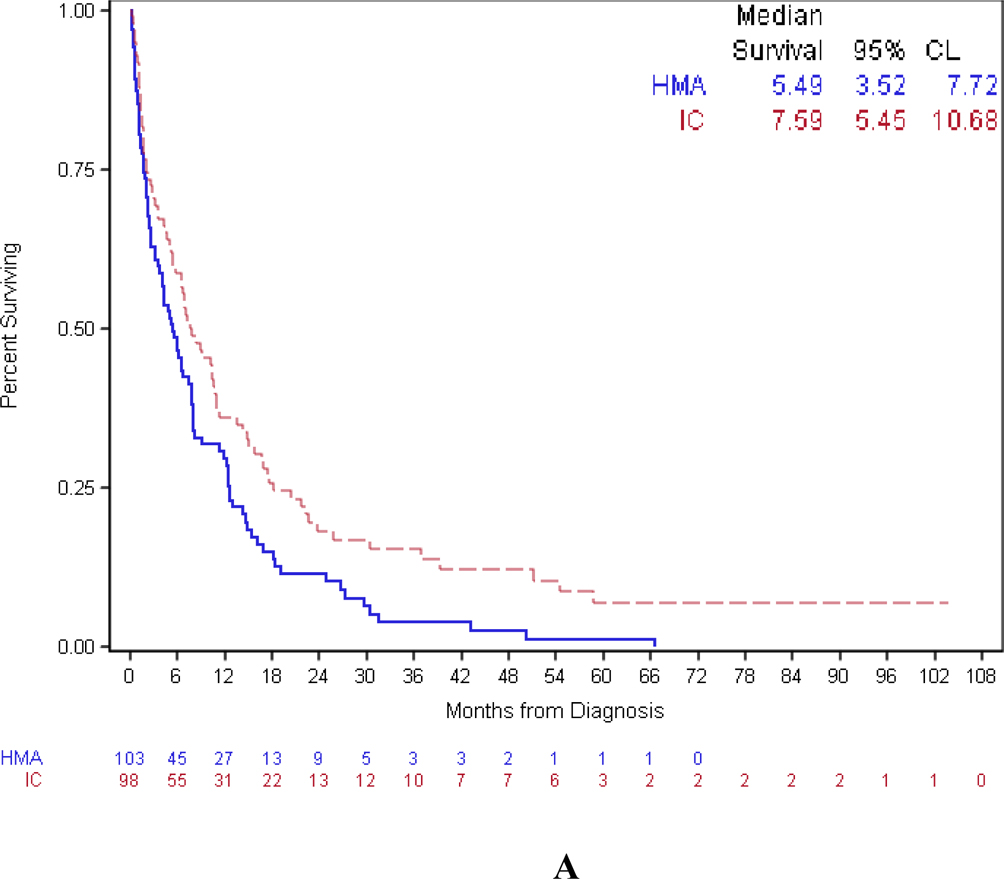
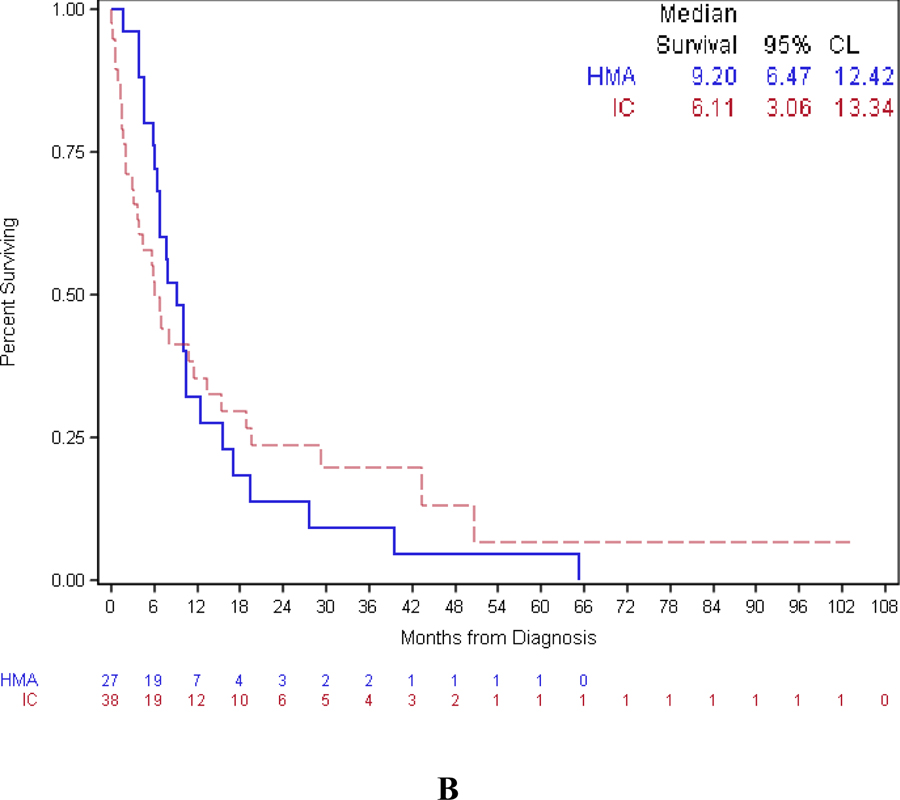
Figure 1:
Kaplan-Meier curves for OS (A) and DOR (B). IC led to an improved OS but results did not reach statistical significance (p=0.07). DOR, similarly, was not statistically different for patients in the two therapy cohorts. OS: overall survival; DOR: duration of response; IC: intensive chemotherapy.


