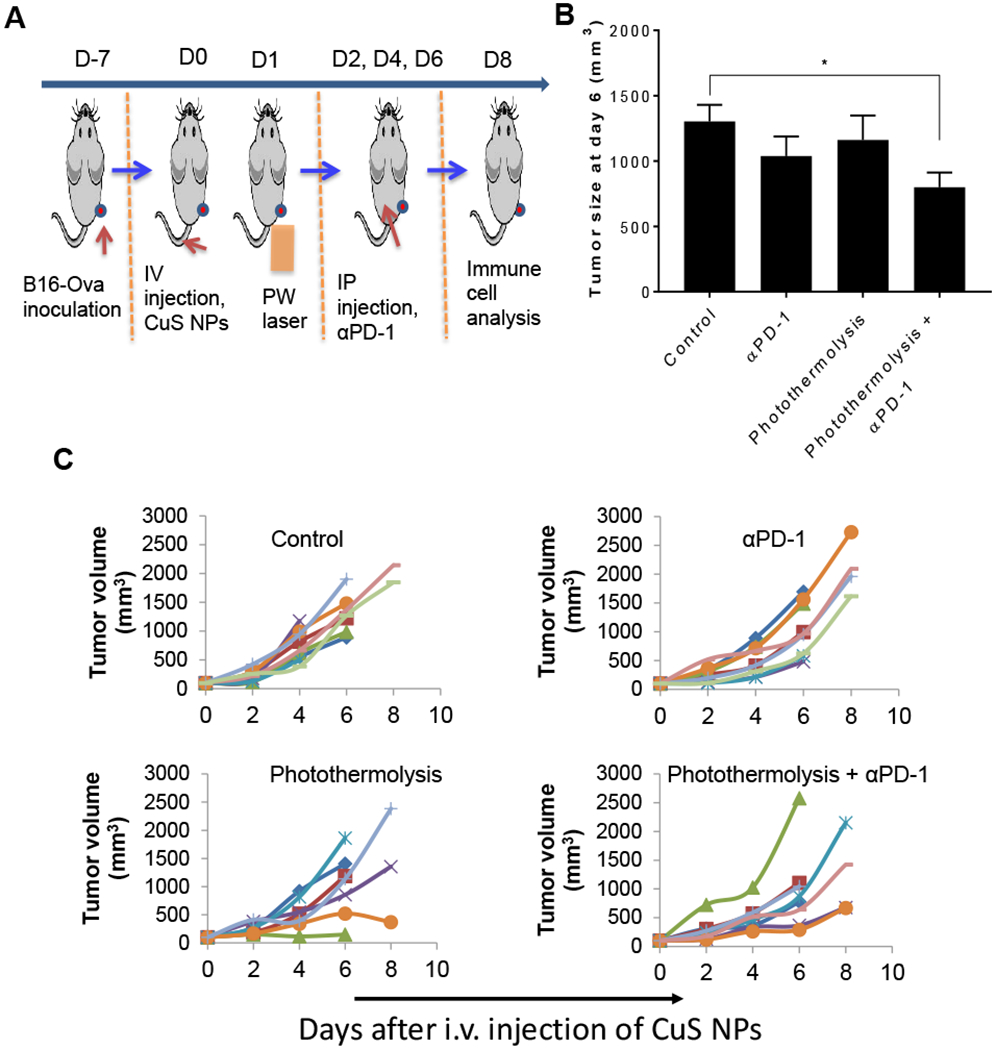
Figure 3.

Antitumor effect of photothermolysis plus αPD-1 on B16-OVA tumor-bearing mice. (A) Experimental design diagram. (B) Tumor size at day 6 after laser treatment. Data are presented as the mean ± standard error of the mean (n = 6/group, *p<0.05). (C) B16-OVA tumor growth curves in individual animals in groups of untreated control mice and mice treated with αPD-1 alone, photothermolysis alone (PEG-CuS NPs + PW laser), and combined photothermolysis + αPD-1. In each panel, each line represents one mouse.
