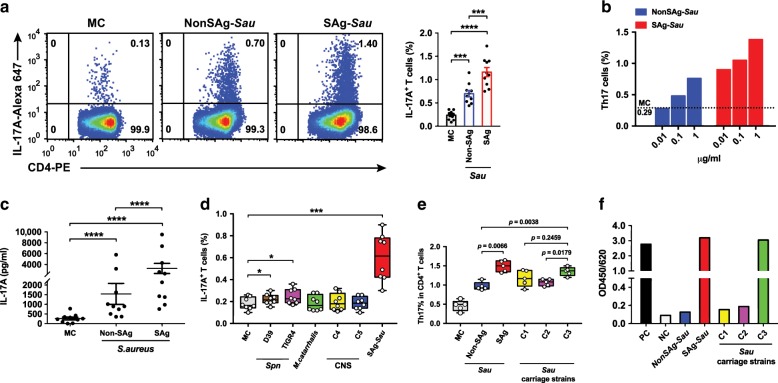
Fig. 1. SAg-Sau activates a potent Th17 response in human tonsillar MNCs.
a, b, d, e Intracellular cytokine analysis of IL-17A-expressing CD4+ T cells (Th17) in isolated human tonsillar MNCs 48 h following bacterial CCS (1 µg/ml) stimulation, compared to media control (MC) MNCs. a Dot plots were gated on CD4+ T cells and numbers in the top right quadrants indicate the percentage of Th17 cells within the CD4+ T cell population. Data were analyzed using paired t-test and displayed in mean ± SEM, n = 10. b Dose-dependent Th17 responses activated by NonSAg-Sau and SAg-Sau, respectively. Results are representative of 3 individual samples. c IL-17A concentration in tonsillar MNCs culture supernatants were measured by ELISA and samples assayed in duplicates. Data displayed is individual data points with mean ± SEM, n = 10. Paired t-test was performed on log-transformed data. d Box and Whiskers plot showing the percentage of Th17 cells within CD4+ T cells in tonsillar MNCs stimulated with Spn, M. catarrhalis, coagulase-negative staphylococcus (CNS, C4 and C5) and SAg-Sau, respectively. e The percentage of Th17 cells within CD4+ T cell population was summarized for tonsillar MNCs activated by NonSAg-Sau, SAg-Sau, and Sau carriage strains (C1, C2, and C3). Data (d, e) was displayed in median (center line), upper and lower quartiles (box limits) and minimum to maximum range (whiskers). 8 (d) and 5 (e) individual samples were tested and analyzed. f Staphylococcal enterotoxin A-E level in Sau strains (PC, positive control. NC, negative control), test was performed in duplicate. *p < 0.05, **p < 0.01, ***p < 0.001, ****p < 0.0001.

