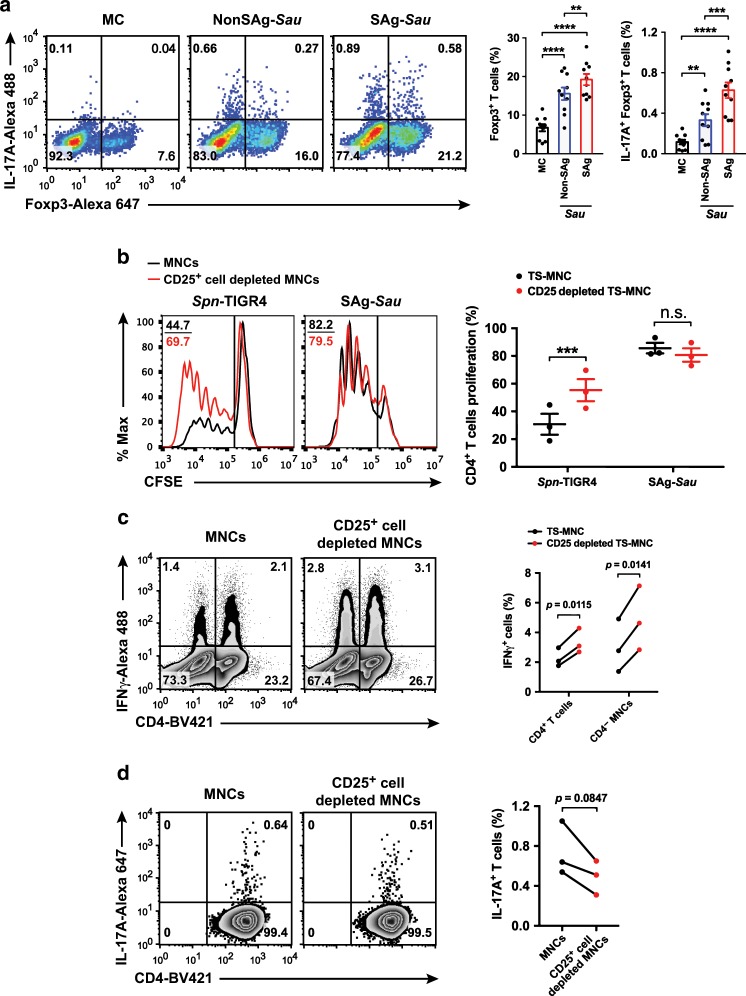
Fig. 2. SAg-Sau-activated Th17 responses are not suppressed by Foxp3+ Tregs.
a Analysis of Treg expansion and IL-17A-expressing Tregs in isolated human tonsillar MNCs 48 h following bacterial CCS (1 µg/ml) stimulation. Dot plots were gated on CD4+ T cells and numbers in bottom right and top right quadrants indicate the percentage of IL-17A− Foxp3+ and IL-17A+ Foxp3+ cells, respectively, within the CD4+ T cell population. Data is displayed as mean ± SEM by column bar graphs and analyzed using paired t-test, n = 10. b Unfractionated MNCs and CD25+ cell depleted MNCs were labeled with CFSE in order to quantify CD4+ T cell proliferation 5 days after SAg-Sau CCS (1 µg/ml) stimulation. Histogram plots were gated on CD4+ T cells showing the median fluorescent intensity (MFI) of CFSE and numbers in the top left corners indicate percentage of proliferated CD4+ T cells. Data points with mean ± SEM are shown in the dot plot on the right with 3 individual samples tested. c, d IL-17A and IFNγ expression after 48 h of SAg-Sau CCS (1 µg/ml) stimulation for unfractionated MNCs and CD25+ cell depleted MNCs. Results were summarized from 3 individual samples. c Zebra plots were gated on lymphocytes and numbers in top left and right quadrants indicate the percentage of IFNγ+ CD4− lymphocytes and IFNγ+ CD4+ T cells (Th1) in total lymphocytes, respectively. d Zebra plots were gated on CD4+ T cells, with the percentage of Th17 cells in CD4+ T cell population shown in the top right quadrants. Data were analyzed using paired t-test. (ns: not significant).

