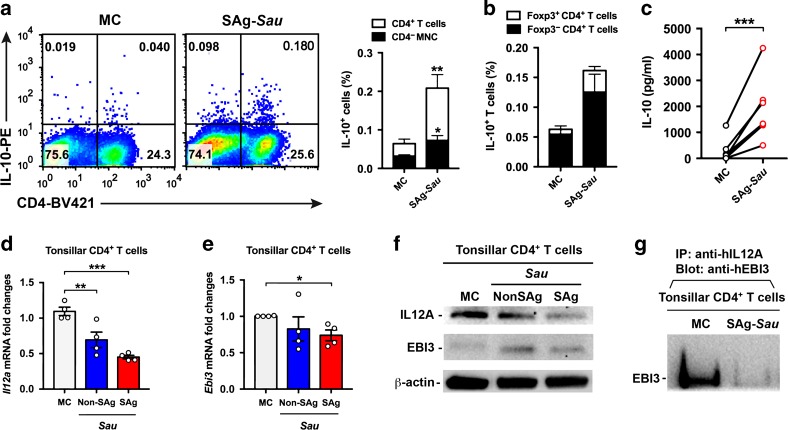
Fig. 3. SAg-Sau stimulation upregulates IL-10 but downregulates IL-35 expression in human tonsillar CD4+ T cells.
a IL-10 expression in tonsillar lymphocytes 48 h following SAg-Sau stimulation. Representative dot plots with numbers in top left and right quadrants indicate the percentage of IL-10+ CD4− and IL-10+ CD4+ T cells within total lymphocyte population. Results from 8 individual samples were analyzed and summarized in the bar chat. b Bar chart showing the percentage of IL-10+ cells within Foxp3+ CD4+ T cell and Foxp3− CD4+ T cell populations, respectively, n = 3. c IL-10 concentration in the culture supernatant of 48 h-cultured MNCs either unstimulated (MC) or stimulated with SAg-Sau. Samples were measured by ELISA in duplicate, n = 7. d, e Tonsillar MNCs were stimulated with SAg-Sau CCS for 24 h following which CD4+ T cell isolation was performed. mRNA was extracted from isolated CD4+ T cells for RT-qPCR. The fold change in Il12a (d) and Ebi3 (e) mRNA expression compared to the media control (MC) are shown. Tests were performed in duplicate, n = 4. f, g Tonsillar MNCs were stimulated with SAg-Sau for 48 h and treated with brefeldin A for 4 h before harvesting cells for CD4+ T cell isolation. f Protein expression of IL-12A and EBI3 subunits in isolated CD4+ T cells. g CD4+ T cell lysate was immunoprecipitated with anti-IL-12A and blotted with anti-EBI3 to detect the expression of IL-35 heterodimer in CD4+ T cells. The blot image (f, g) are representative of 3 independent experiments. Data (a, b, c, d, e) were analyzed using paired t-test.

