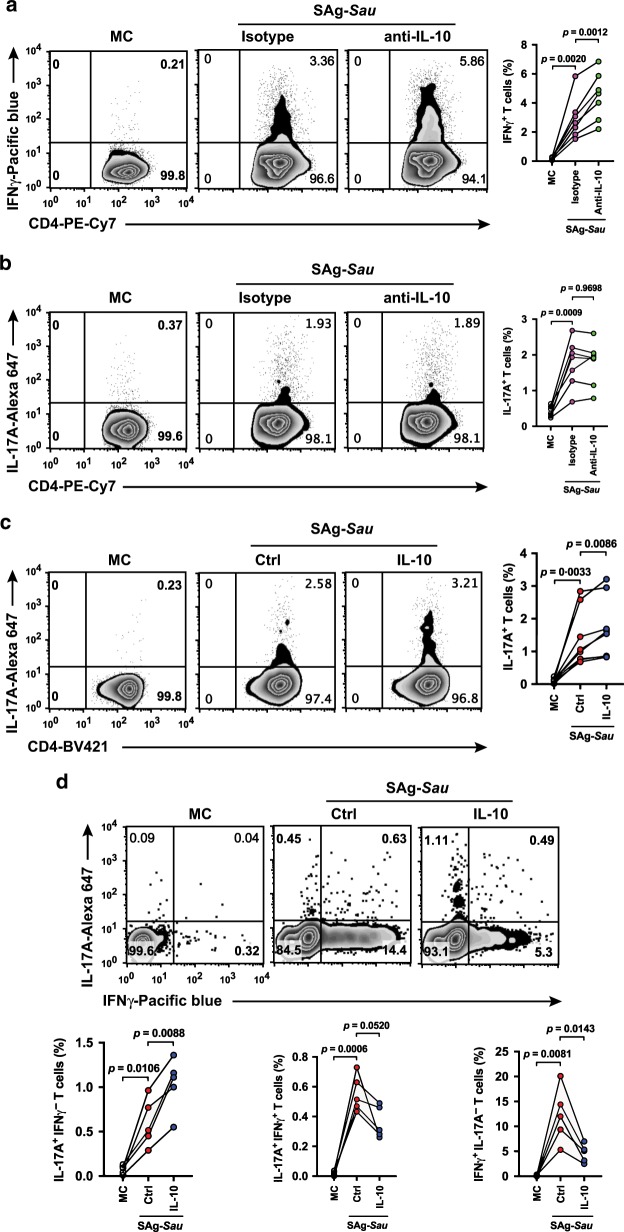
Fig. 4. IL-10 suppresses SAg-Sau-activated Th1 response but not the Th17 response.
a, b Analysis of IL-17A or IFNγ expressing CD4+ T cell responses in SAg-Sau stimulated tonsillar MNCs treated with IL-10 neutralizing antibody or isotype control. MC is unstimulated media control. Zebra plots were gated on CD4+ T cells and numbers in top right quadrants indicate the percentages of Th1 (a) or Th17 (b) within CD4+ T cell population. Data was analyzed using paired t-test with p values indicated, n = 7. c, d CD69+ cell depleted tonsillar MNCs were stimulated with SAg-Sau CCS in the presence or absence of recombinant IL-10 (10 ng/ml) for 48 h. Ctrl is the stimulation control. c Numbers in top right quadrants of the zebra plots indicate the percentage of Th17 in CD4+ T cells. Results of 8 individual samples were analyzed and summarized in symbol and line plot. d The percentage of IL-17A+IFNγ-, IL-17A+IFNγ+, and IL-17A-IFNγ+ cells within CD4+ T cell population is shown in top left, top right and bottom right quadrants of the zebra plots. Summarized data is displayed in symbol and line plot, n = 5.

