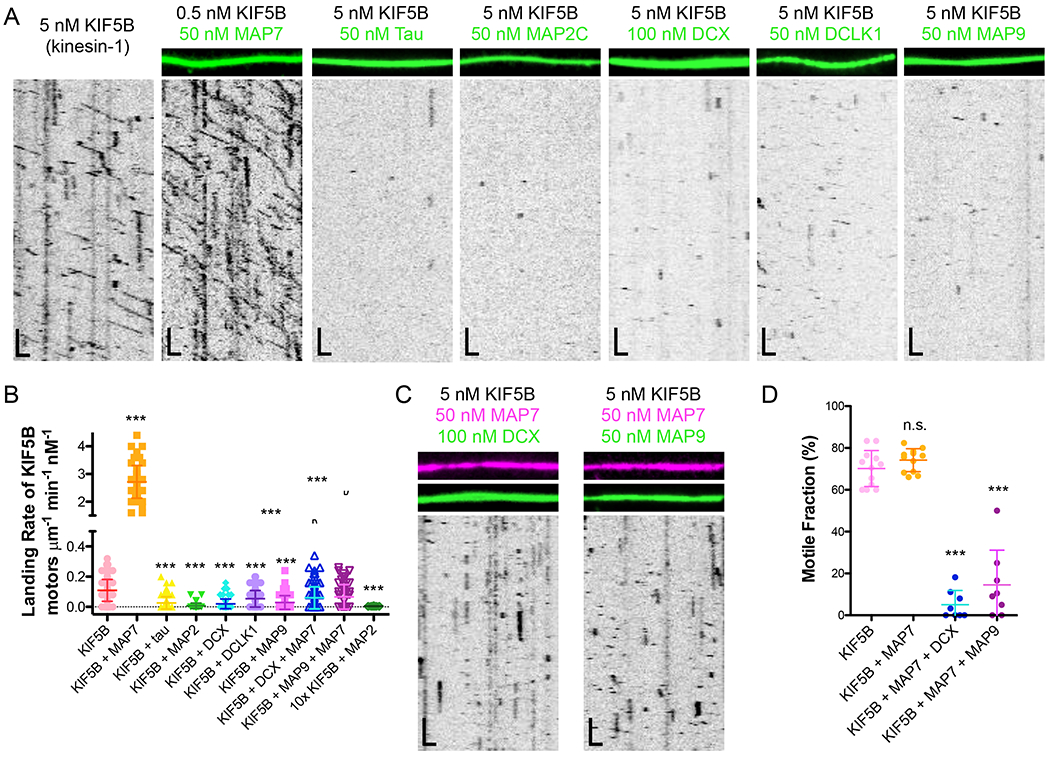
Figure 1. Kinesin-1 is inhibited from landing and progressing on the microtubule lattice by tau, MAP2C, DCX, DCLK1, and MAP9.

(A) TIRF-M images and kymographs of KIF5B-mScarlet (kinesin-1) at indicated concentrations + 1 mM ATP in the absence and presence of 50 nM sfGFP-MAP7, 50 nM sfGFP-tau, 50 nM sfGFP-MAP2C, 100 nM DCX-sfGFP, 50 nM sfGFP-DCLK1, or 50 nM sfGFP-MAP9. Scale bars: 1 μm (x), 10 sec (y). (B) Quantification of the landing rates of KIF5B-mScarlet + 1 mM ATP in the absence and presence of each MAP or MAP combination (means ± s.d. in motors μm−1min−1nM−1 are: 0.11 ± 0.07 for KIF5B alone (n=134 kymographs from 3 independent trials), 2.72 ± 0.59 for KIF5B + MAP7 (n=83 kymographs from 2 independent trials), 0.03 ± 0.04 for KIF5B + tau (n=100 kymographs from 2 independent trials), 0.01 ± 0.02 for KIF5B + MAP2C (n=93 kymographs from 2 independent trials), 0.02 ± 0.03 for KIF5B + DCX (n=94 kymographs from 2 independent trials), 0.05 ± 0.05 for KIF5B + DCLK1 (n=92 kymographs from 2 independent trials), 0.03 ± 0.05 for KIF5B + MAP9 (n=96 kymographs from 2 independent trials), 0.06 ± 0.07 for KIF5B + MAP7 + DCX (n=114 kymographs from 2 independent trials), 0.07 ± 0.08 for KIF5B + MAP7 + MAP9 (n=70 kymographs from 2 independent trials), and 0.005 ± 0.001 for 10x the concentration of KIF5B (50 pM) + MAP2C (n=20 kymographs from 2 independent trials). All datapoints are plotted with lines indicating means ± s.d. P < 0.0001 (***) calculated by one-way ANOVA with Bonferroni correction. (C) TIRF-M images and kymographs of 5 nM KIF5B-mScarlet + 1 mM ATP in the presence of 50 nM BFP-MAP7 (pink) with 100 nM DCX-sfGFP (green), or 50 nM BFP-MAP7 (pink) with 50 nM sfGFP-MAP9 (green). Scale bars: 1 μm (x), 10 sec (y). (D) Quantification of the percentage of motile KIF5B motors in the absence (70.2 ± 8.6 %; n=169 molecules from 12 kymographs from 3 independent trials) or presence of 50nM MAP7 (76.2 ± 5.5; n=160 molecules from 12 kymographs from 2 independent trials), 50 nM MAP7 with 100 nM DCX (5.1 ± 6.8; n=160 molecules from 8 kymographs from 2 independent trials), or 50 nM MAP7 with 50 nM MAP9 (14.5 ± 16.6; n=111 molecules from 8 kymographs from 2 independent trials). P < 0.0001 (***) and P = 0.0540 (n.s.) calculated by one-way ANOVA with Bonferroni correction.
