Fig. 3.

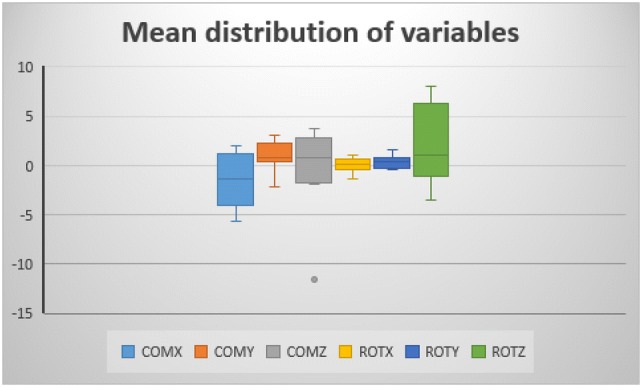
The confidence interval (CI) of all measurements. COM centre of mass translational difference, ROT rotational difference. X, Y, and Z represent the three Euler’s axis for COM and ROT, respectively

The confidence interval (CI) of all measurements. COM centre of mass translational difference, ROT rotational difference. X, Y, and Z represent the three Euler’s axis for COM and ROT, respectively