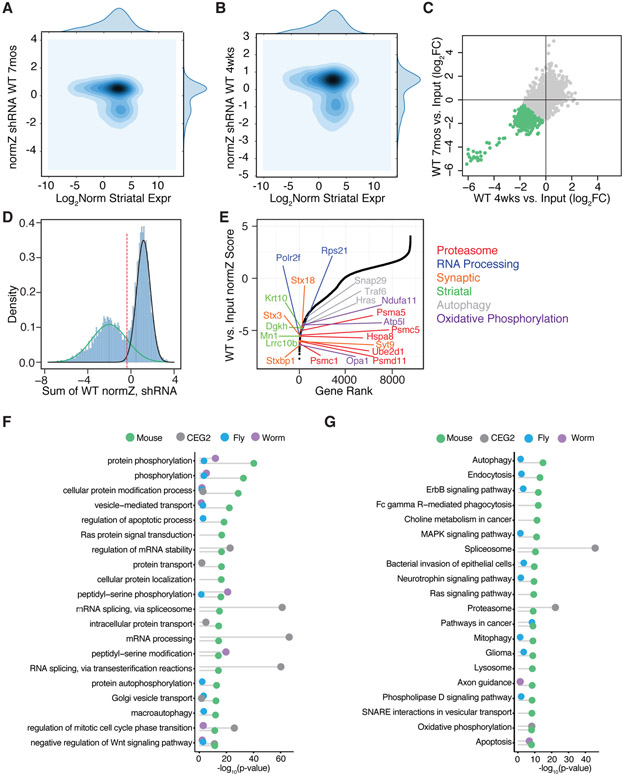
Figure 2. Identification of Neuronal Essential Genes by Pooled Genome-wide in vivo Screening.
Contour plots of normZ scores vs. log2 WT striatal gene expression for the 7-month (A) and 4-week (B) shRNA screens. (C) Scatterplot of the log2 normalized fold-change in WT compared to input library at 4 weeks vs. 7 months after in vivo incubation with the genome-wide shRNA library. Green points represent individual shRNA hairpins with an average of > 1 log2 fold depletion in shRNA representation at 4 weeks and 7 months. Pearson correlation r = 0.78. (D) Density plot of the sum normZ scores for the WT shRNA screens shows a bimodal distribution overlaid with two Gaussians to highlight the depleted essential genes (green) as compared to the non-essential genes (black). Genes were identified as candidate neuronal essential genes below the threshold of the intersection of the two Gaussians (red dotted line). (E) Plot of normZ values vs. rank of candidate neuronal essential genes. Top candidate essential genes in relevant biological pathways are highlighted in color as marked. (F) Plots of top GO terms and (G) KEGG pathways significantly associated with candidate neuronal essential genes identified by in vivo screening from the current study (green), C. elegans (purple) and D. melanogaster (blue), as well as human core essential genes in the CEG2 list (grey) represented with Fisher’s exact test −log10 p-value.

