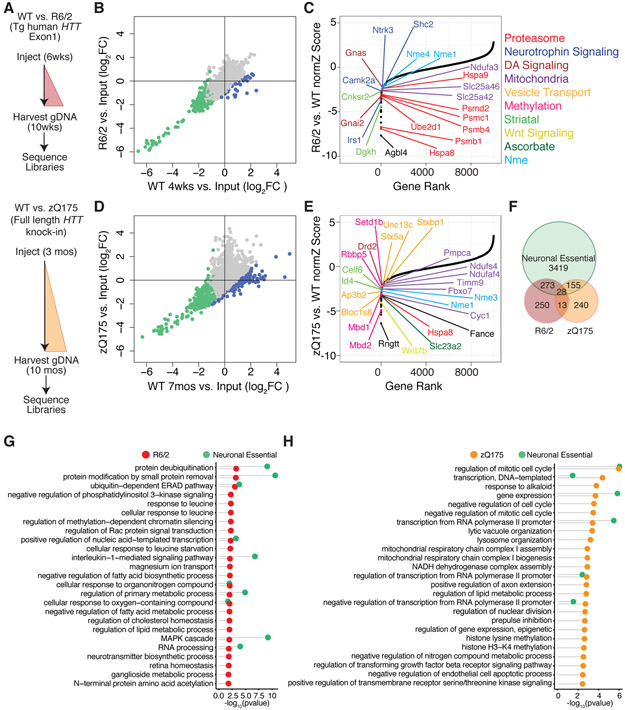
Figure 4. Identification of in vivo Modifiers of Neuronal Cell Death in the R6/2 and zQ175 HD Mouse Models.
(A) Schematic of genome-wide shRNA screening in HD model and isogenic control mice at disease-relevant time points. (B and D) Scatterplots of the log2 normalized fold-change in shRNA representation in R6/2 or zQ175 mice vs. isogenic WT controls. Blue points represent individual hairpins with > 1 log2 fold differential depletion in mutant vs. WT. Green points represent individual shRNA hairpins with an average of > 1 log2 fold depletion in average shRNA representation in WT compared to input library (Figure 2C). Pearson correlation r = 0.94 (R6/2) and r = 0.81 (zQ175). (C and E) Plots of normZ scores vs. rank of candidate protective factors identified by DrugZ analysis in R6/2 and zQ175 models. Top genes in relevant biological pathways are highlighted in color as marked. (F) Venn diagram of neuronal essential genes vs. HD genetic modifiers. 41 (28+13) candidate protective factors are common to both the R6/2 and zQ175 screens, hypergeometric p-value = 1.30e-4. (G and H) Top GO terms significantly associated with candidate protective factors unique to the R6/2 (red) and zQ175 (orange) models respectively, as well as essential genes identified in Figure 3 (green) represented with Fisher’s exact test –log10 p-value < 0.05.

