Table 3.
Content types visualized in a feedback intervention study sample (n = 43)
| Content type | Form | Sub- total | Total | Example Chart | Example Table |
|---|---|---|---|---|---|
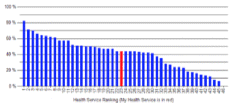
| Ascribee Performance (AP) | Chart | 12 | 16 |
Peiris et al. 2015 [21] |
Beck et al. 2005 [22] |
| Table | 4 | ||||
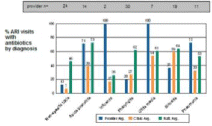
| Measure Ascribee Performance (MAP) | Chart | 2 | 9 |
Linder et al. 2010 [19] |
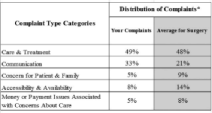
Pichert et al. 2013 [23] |
| Table | 7 | ||||
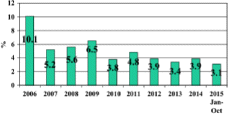
| Ascribee Performance Time (APT) | Chart | 7 | 7 |
Capraro et al. 2012 [24] |
None |
| Measure Performance (MP) | Chart | 1 | 8 |
Peiris et al. 2015 [21] |
Gude et al. 2016 [25] |
| Table | 7 | ||||
| Performance Time (PT) | Chart | 2 | 2 |
Blomberg et al. 2016 [26] |
None |
| Measure Ascribee Performance Time (MAPT) | Table | 1 | 1 | None |
Rantz et al. 2001 [27] |
| Total of studies | 43 | ||||
Content types are combinations of Measure, Ascribee, Performance level or Time interval (MAPT) sets


