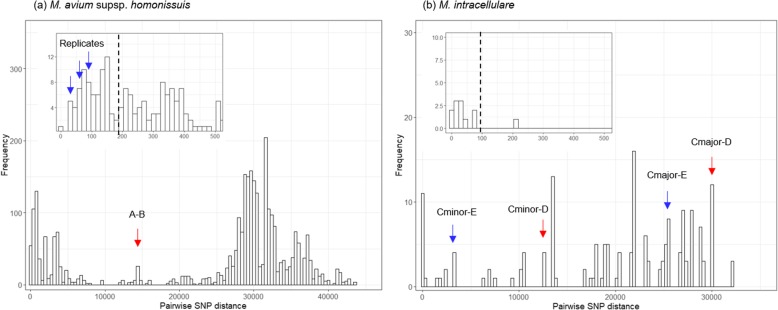
Fig. 1.
Histograms of pairwise SNP distances. The x-axis shows pairwise SNP distance and the y-axis shows the frequencies of distances between isolates. (a) Distances between replicates of M. avium subsp. hominissuis (blue arrow) were less than 200 (black dashed line), whereas the distance between isolates from Patient A and B (red arrow) was 14,768. (b) The distance between M. intracellulare isolates from Patients C and D living together in HOME-2 (red arrow) was higher than the distance between isolates from Patients C and E living in other houses (blue arrow)

