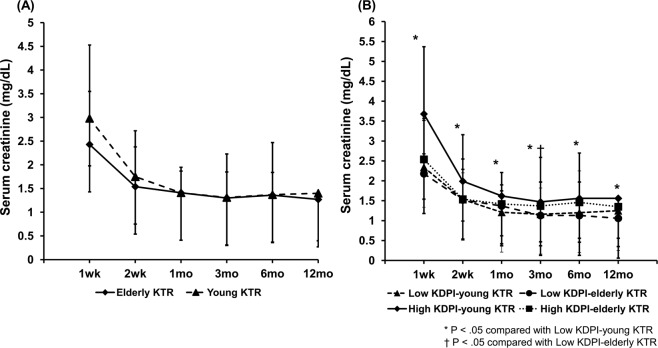
Figure 1.
Comparison of the changes of allograft function (serum creatinine level) after KT (A) between the elderly KTR and young KTR groups and (B) among the four subgroups (low KDPI-young KTR, low KDPI-elderly KTR, high KDPI-young KTR and high KDPI-elderly KTR subgroup). *P < 0.05 vs. low KDPI-young KTR, †P < 0.05 vs. low KDPI-elderly KTR. Abbreviations: KT, kidney transplantation; KTRs, kidney transplant recipients; KDPI, kidney donor profile index.

