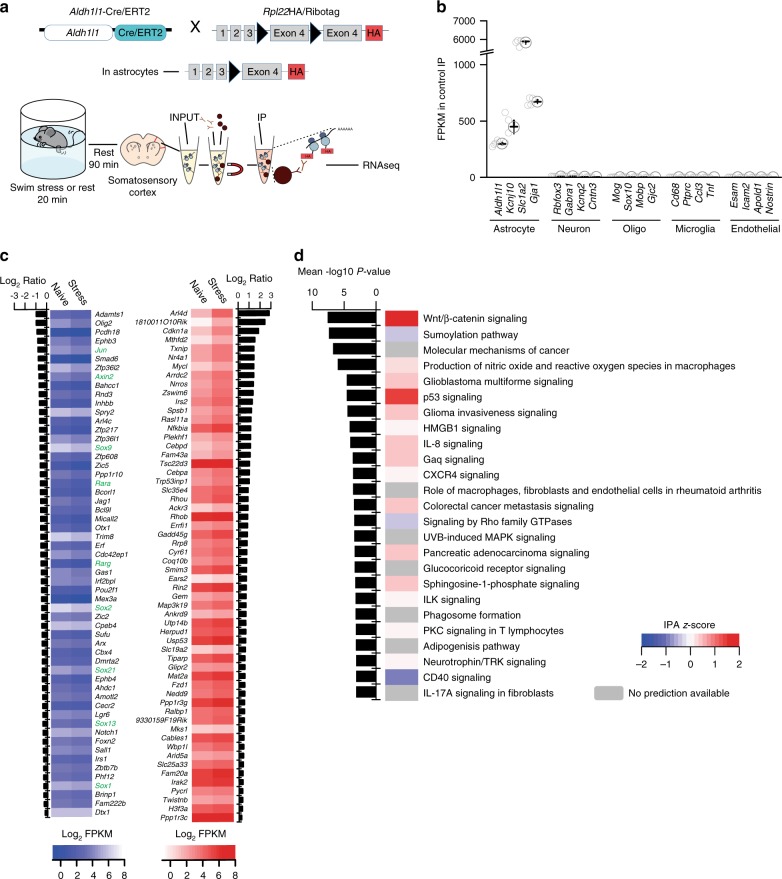
Fig. 1. Acute stress alters astrocyte genes associated with connexins and cell growth.
a Upper – illustration of how the knock-in mouse line used for astrocyte RNAseq experiments was generated. Lower – illustration of experimental protocol used. INPUT indicates total RNA (not specific to astrocytes). IP indicates immunoprecipitate, whereby astrocyte ribosomes were isolated. b Validation of RNAseq specificity using Aldh1l1-cre/ERT2 X RiboTag mouse, comparing the expression of several astrocyte-specific with non-specific (i.e. non-astrocytic) genes in our immunoprecipitated (IP) sample. Error bars – mean ± s.e.m. c Heat map of gene expression changes following stress (FDR < 0.05). Upregulated genes in red. Downregulated genes in blue. Green denotes genes involved in Wnt/B-catenin signaling pathway. d Top 25 IPA (Ingenuity Pathway Analysis, Qiagen) Canonical Pathways modified by a single bout of acute stress. The IPA z-score indicates the predicted inhibition, in blue, or activation, in red, of the pathways in accordance with the gene expression changes.

