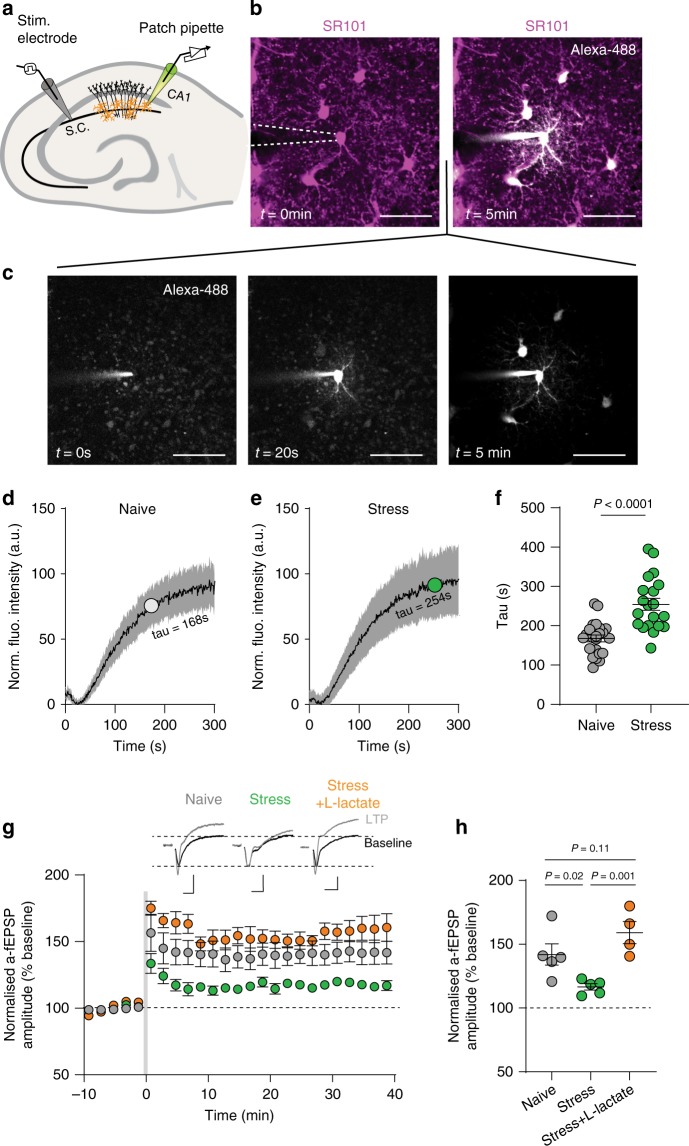
Fig. 7. l-lactate delivery through astrocytes rescues stress-induced impairment of LTP in the hippocampus.
a Schematic representation of subsequent patch-clamp experiments in CA1 region of ventral hippocampus (s.c. denotes schaffer collateral). b Representative images depicting a dye flux through astrocyte network in ventral hippocampal slices, before patching (left) and 5 min after whole-cell patch (right). Scale bar 50 µm. c Series of images from b depicting progression of dye flux through gap junction connected astrocytes at 0 s, 20 s, and 5 min. d Mean trace of coupling in naïve group with tau value indicated. Error indicates standard deviation. n = 23 cells. e Mean trace of coupling in stress group with tau value indicated. Error indicates standard deviation. n = 20 cells. f Scatter dot plot quantifying coupling between hippocampal astrocytes in naïve and stress conditions. Naïve: n = 23 cells, stress: n = 20 cells. Error bars: mean ± s.e.m. g Time series comparing hippocampal LTP in naïve, stress, and stress+l-lactate conditions, measured through astrocyte-patch technique. High-frequency stimulation (HFS) indicated by gray bar. Naïve: n = 3 mice, n = 5 cells; Stress: n = 3 mice, n = 5 cells; Stress+l-lactate: n = 3 mice, n = 4 cells. Error bars: mean ± s.e.m. Inset, representative a-fEPSP traces pre- and post-LTP induction. Scale bars: 0.5 mV,10 ms. h Scatter dot plot comparing amplitude of potentiation at 30–40 min post HFS from g. Error bars: mean ± s.e.m. One-way ANOVA, F = 9.46, P = 0.0041.

