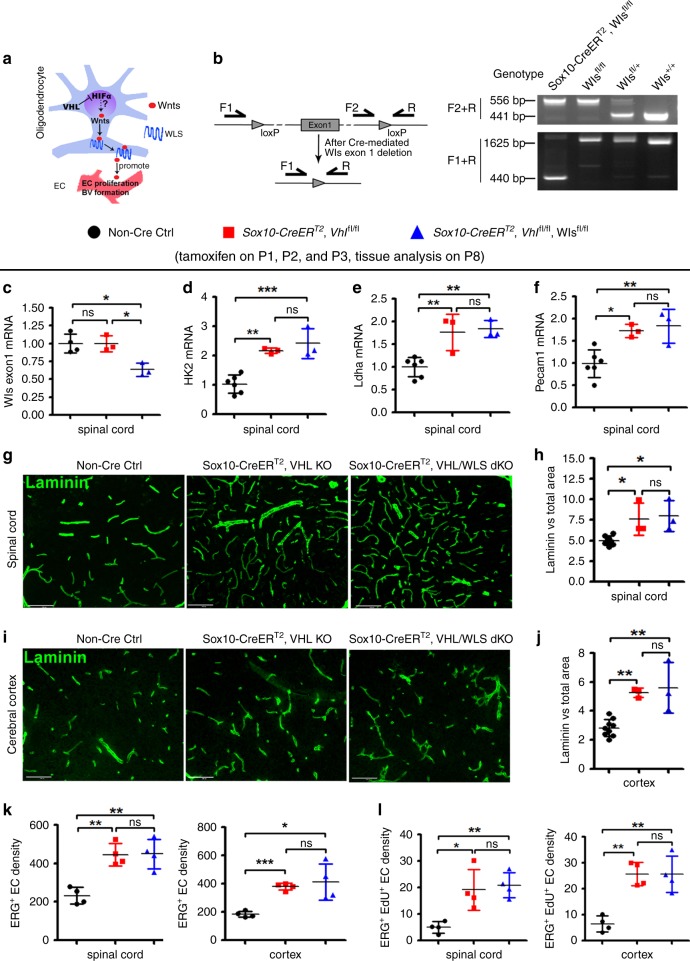
Fig. 4. Blocking Wnt secretion from oligodendroglial lineage cells does not affect HIFα-regulated CNS angiogenesis.
a Schematic diagram depicting putative regulation between HIFα-Wnt axis in glio-vascular units. b Primer design (left) and PCR detection (right) of Wls gene deletion. Primer pair of F2/R is for detecting Wls floxed allele (556bp). After Cre-mediated deletion, primer pair F1/R generates a 410 bp product from the genome of Sox10-CreERT2,Wlsfl/fl mice. c RT-qPCR assay of exon 1-coding Wls mRNA. One-way ANOVA followed by Tukey’s multiple comparisons, *P < 0.05, ns, not significant. F(2,7) = 10.39, P = 0.008. n = 4 Ctrl, 3 VHL cKO, 3 VHL/WLS cKO. d–f, RT-qPCR assay of Hk2, Ldha, and Pecam1 mRNA. One-way ANOVA followed by Tukey’s multiple comparisons, *P < 0.05, **P < 0.01, *** P < 0.001, ns, not significant. F(2,9) = 21.73, P = 0.0004 Hk2, F(2,9) = 14.14, P = 0.0017 Ldha, F(2,9) = 10.39, P = 0.0046 Pecam1. n = 6 Ctrl, 3 VHL cKO, 3 VHL/WLS cKO. g, h Representative confocal images of Laminin-positive blood vessels in the spinal cord and the percent of Laminin-positive BV area among total assessed area. One-way ANOVA followed by Tukey’s multiple comparisons, *P < 0.05, ns, not significant. F(2,11) = 8.8, P = 0.0052. n = 8 Ctrl, 3 VHL cKO, 3 VHL/WLS cKO. Scale bars = 100 µm. i, j Representative confocal images of Laminin-positive blood vessels in the forebrain cerebral cortex and the percent of Laminin-positive BV area among total assessed area. One-way ANOVA followed by Tukey’s multiple comparisons, **P < 0.01, ns, not significant. F(2,12) = 16.47, P = 0.0004. n = 9 Ctrl, 3 VHL cKO, 3 VHL/WLS cKO. Scale bars = 100 µm. k Densities (#/mm2) of ERG+ endothelial cells. One-way ANOVA followed by Tukey’s multiple comparisons, *P < 0.05, **P < 0.01, ns, not significant. F(2,9) = 16.89, P = 0.0009 spinal cord; Welch’s ANOVA followed by unpaired t test with Welch’s correction, W(2,5.346) = 65.98, P = 0.0002 cortex. n = 4 Ctrl, 4 VHL cKO, 4 VHL/WLS cKO. l Densities (#/mm2) of ERG+/EdU+ proliferating endothelial cells (2 h EdU pulse labeling prior to tissue harvesting at P8). One-way ANOVA followed by Tukey’s multiple comparisons, *P < 0.05, **P < 0.01, ns, not significant. F(2,9) = 10.63, P = 0.0043 spinal cord, F(2,9) = 18.43, P = 0.0007 cortex. n = 4 Ctrl, 4 VHL cKO, 4 VHL/WLS cKO. Data are shown as mean ± s.d. Source data of c–f, h, j, k, l are provided as a Source Data file.

