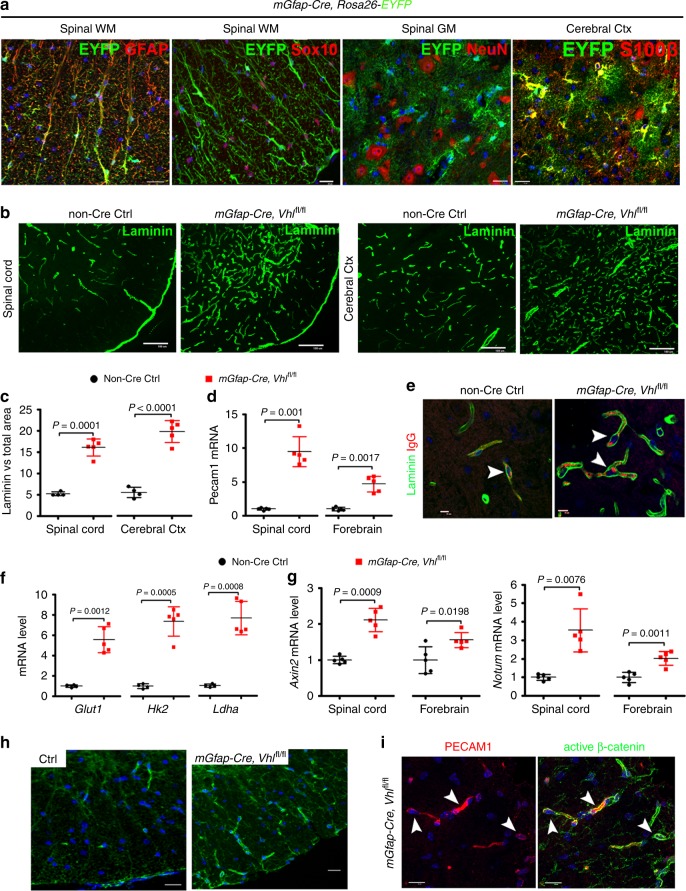
Fig. 8. Astroglial HIFα stabilization promotes CNS angiogenesis and enhances Wnt signaling activity.
a Fate-mapping study showing that mGfap-Cre-mediated EYFP was expressed in GFAP+ astrocytes but not in Sox10+ oligodendroglial lineage cells or NeuN+ neurons in the spinal cord at P60. WM, white matter, GM, gray matter, Ctx, cortex. EYFP was identified as S100β+ astrocytes in the cerebral Ctx. Scale bars = 20 μm. b Representative images of Laminin immunostaining in mGfap-Cre, Vhlfl/fl mutants and non-Cre control mice at P30. Scale bars = 100 μm. c Percentage of Laminin-occupying area among total area at P30. Two-tailed Student’s t test, Welch’s corrected t(4) = 11.92 spinal crd, t(7) = 10.12 cerebral cortex. n = 4 Ctrl, 5 VHL cKO. d RT-qPCR assay of endothelial Pecam1 at P30. Two-tailed Student’s t test, Welch’s corrected t(4.046) = 8.564 spinal cord, Welch’s corrected t(4.490) = 6.706 forebrain. n = 5 each group. e immunostaining showing that endogenous mouse IgG is restricted to Laminin+ blood vessels (arrowheads) in the early adult spinal cord of mGfap-Cre,Vhlfl/fl mutant and control mice at P47. Scale bars = 10 μm. f RT-qPCR assay of the mRNA levels of HIFα target gene Glut1, Hk2 and Ldha in P30 spinal cord. Two-tailed Student’s t test with Welch’s correction, t(4.099) = 7.947 Glut1, t(4.243) = 9.636 Hk2, t(4.085) = 9.025 Ldha. n = 4 Ctrl, 5 VHL cKO. g RT-qPCR assay of the mRNA levels of Wnt/β-catenin target genes Axin2 and Notum at P30. Two-tailed Student’s t test, Welch’s corrected t(4.760) = 7.296 spinal cord Axin2, t(8) = 2.902 forebrain Axin2, Welch’s corrected t(4.149) = 4.850 spinal cord Notum, t(8) = 4.994 forebrain Notum. n = 5 each group. h Immunostaining of active β-catenin in the spinal cord of mGfap-Cre, Vhlfl/fl mutants and non-Cre control mice at P30. Scale bars = 10 μm. i Double immunostaining of active β-catenin and PECAM1 in the spinal cord of mGfap-Cre, Vhlfl/fl mutants at P30. Arrowheads point to double-positive cells. Blue is DAPI nuclear staining. Scale bars = 10 μm. Data are shown as mean ± s.d. Source data of c, d, f, g are provided as a Source Data file.

