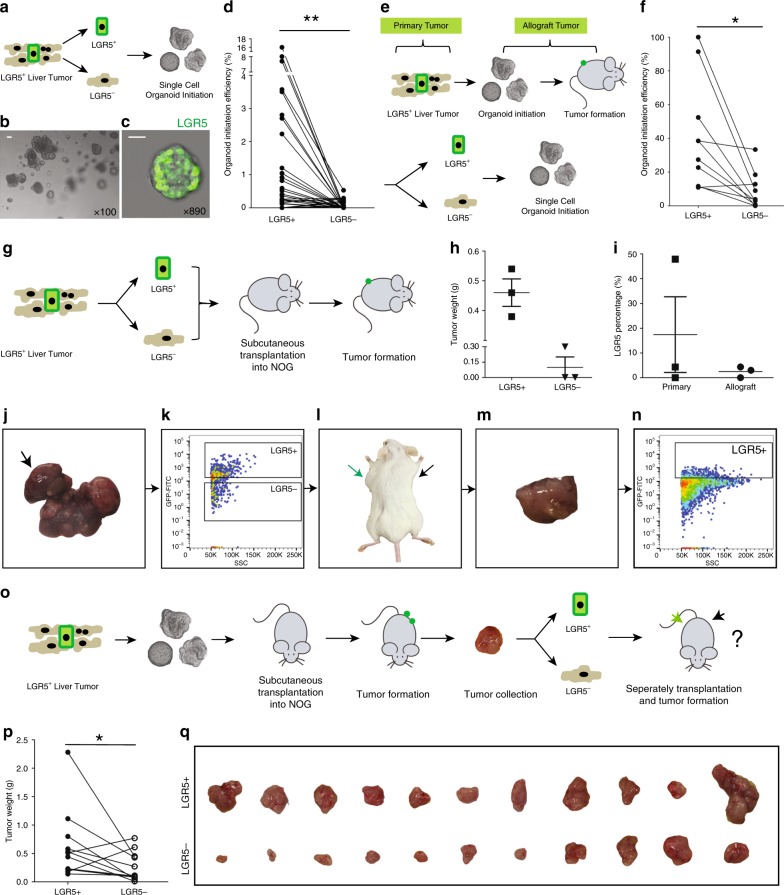
Fig. 4. Single LGR5+ cells from liver tumors are superior in organoid and tumor initiation.
a An outline of the experimental strategy for studying ex vivo organoid initiation of cells derived from primary murine liver tumors. b A representative picture of organoids derived from single LGR5+ cells. Scale bar = 50 µm. c Representative confocal micrograph of a single LGR5+ cell-initiated organoid dominated by LGR5-expressing cells. LGR5-driven GFP: green. Scale bar = 20 µm. d Organoid initiation efficiency of LGR5–GFP+ and LGR5–GFP− cells, isolated from primary tumors (LGR5+ cells: 25 out of 71 tissues, 35.2%; LGR5− cells: 11 out of 71 tissues, 15.5%) (paired T test, 2.13 ± 0.67% vs. 0.065 ± 0.023%, n = 30, P = 0.0048). e An outline of the strategy used to study ex vivo organoid initiation of allograft tumor-derived cells. f Efficiency of organoid initiation by allograft liver tumor-derived LGR5–GFP+ and LGR5–GFP− cells (paired T test, 40.46 ± 10.19% vs. 9.84 ± 3.93%, n = 10, P = 0.0187). g Outline of the experimental strategy used to assess in vivo tumor initiation of cells isolated from primary murine liver tumors. h Weight of tumors initiated by LGR5+ and LGR5− cells (LGR5+ vs. LGR5−: 0.46 ± 0.046 g vs. 0.10 ± 0.10 g, n = 3) (formed tumor number: LGR5+ cells—3 out of 9; LGR5− cells—1 out of 9). i LGR5 expression in single LGR5+ cell-derived allograft tumors and the corresponding primary tumors (17.42 ± 15.29% vs. 2.47 ± 1.27%, n = 3). j–n Representative pictures showing that LGR5–GFP+ and LGR5–GFP− cells (k) were isolated from DEN-induced primary liver tumors (j). Then, LGR5–GFP+ cells (green arrow) initiated allograft tumors in immunodeficient mouse (l–n). The initiated allograft tumors sustained LGR5 expression (n). o An outline of the experimental strategy for in vivo tumor initiation assay of cells isolated from allograft murine liver tumors. p, q Tumor weight (p) and macroscopic aspect (q) of allografts initiated by LGR5–GFP+ cells and LGR5–GFP− cells (isolated from allograft tumors) (0.64 ± 0.19 g vs. 0.27 ± 0.08 g, n = 11, P = 0.0418). Mean ± SEM. Source data are provided as a Source Data file.

