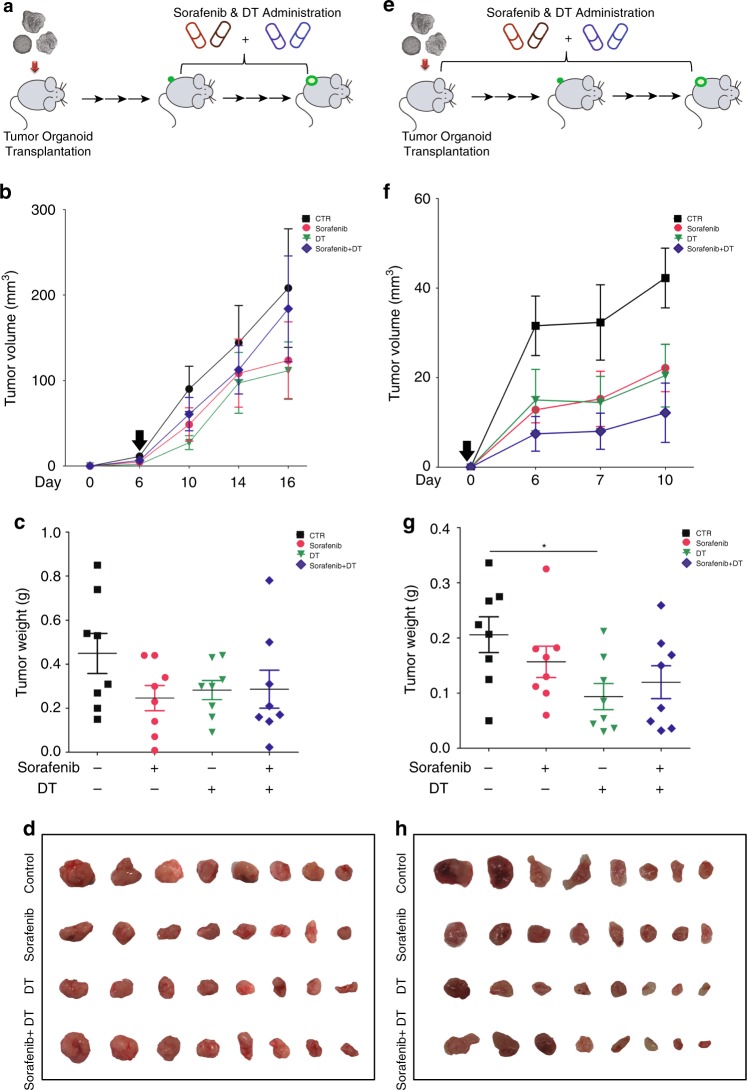
Fig. 7. Combination of LGR5 lineage ablation with sorafenib does not enhance the efficacy.
a Outline of the experimental strategy to assess the combinatory effect of LGR5 lineage ablation with sorafenib. Sorafenib and DT were administered every other day for in total 10 days since visualization of tumor formation after organoid engraftment. b Representative growth curves showing tumor volumes in the vehicle control (CTR), sorafenib, DT, and sorafenib + DT-treated groups. Black arrow: onset of administration. c Tumor masses from these four groups (CTR vs. sorafenib vs. DT. vs. sorafenib + DT: 0.45 ± 0.09 g, n = 8 vs. 0.25 ± 0.06 g, n = 8 vs. 0.28 ± 0.043 g, n = 8 vs. 0.29 ± 0.09, n = 8). d Images showing tumors from these four groups. e Outlines of the experimental strategy for assessing the effects of combining LGR5 lineage ablation and sorafenib treatment. Sorafenib, DT, or the combination were administered immediately since transplantation of the organoids every other day, for in total 10 days. f Representative growth curves showing tumor volumes of the four groups. Black arrow: onset of administration. g The tumor masses of these four groups (CTR vs. sorafenib vs. DT vs. sorafenib + DT: 0.21 ± 0.03 g, n = 8 vs. 0.16 ± 0.03 g, n = 8 vs. 0.09 ± 0.02 g, n = 8 vs. 0.12 ± 0.03 g, n = 8). h Images showing the tumors from the different groups. Mean ± SEM. Source data are provided as a Source Data file.

