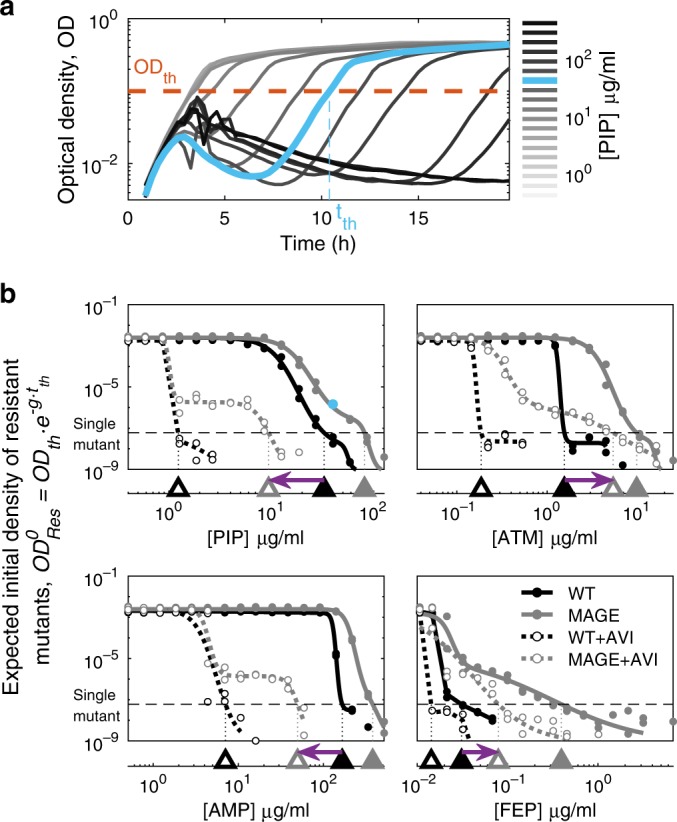
Fig. 2. Combined with avibactam, different drugs differ substantially in the potential for escape mutations.

a Growth of the MAGE mutant library on a gradient of PIP concentrations plotted as Optical Density (OD) as a function of time. The time tth at which culture density crosses a set OD threshold=0.1 is determined (). b The initial density of resistant mutants calculated based on tth and plotted for the WT (black) and the MAGE library (grey) on gradients of four beta-lactam antibiotics individually (filled symbols, 40 μg/ml PIP in cyan corresponds to panel a) and when supplemented with AVI (no-fill symbols). The drug concentration beyond which the value of drops below a density corresponding to a single initial mutant is determined (triangles on the bottom axis). The shift in the concentration required to inhibit the mutant library in the presence of AVI, compared to that required for the WT in the absence of AVI, is indicated by a purple arrow. A left-pointing arrow indicates that at the presence of AVI, no single mutant could grow at the drug-only MIC, while a right-pointing arrow is an indication for escape mutants. Source data are provided as a Source Data file.
