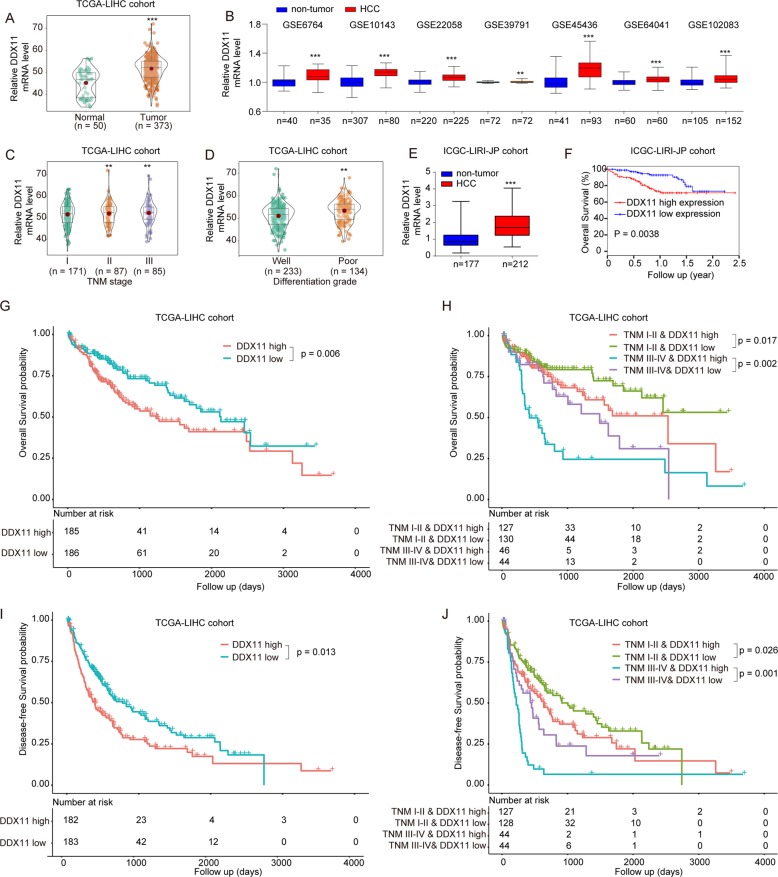
Fig. 3. Bioinformatics analysis of DDX11 expression in TCGA and GEO database.
a, b DDX11 mRNA expression levels were analyzed in HCC tissues from TCGA-LIHC cohort or GEO databases. c, d DDX11 mRNA expression levels were analyzed in HCC patients with different TNM stage or differentiation grade based on the dataset from TCGA-LIHC cohort. e, f DDX11 mRNA expression in HCC tissues or non-tumor control tissues and the correlation between OS and high- or low- DDX11 expression were in ICGC-LIRI-JP cohort. g, h OS and DFS analysis of the HCC patients with high- or low- DDX11 expression in TCGA-LIHC cohort. i, j OS and DFS analysis of the HCC patients with different TNM stages and DDX11 expression. *p < 0.05, **p < 0.01, ***p < 0.001.

