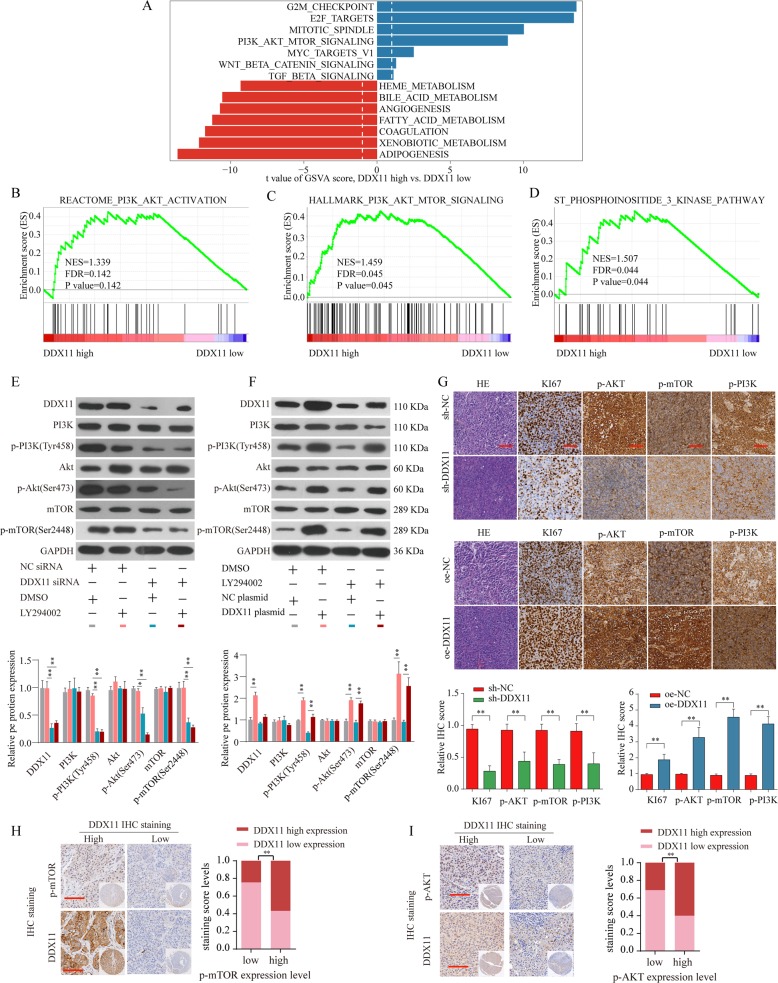
Fig. 6. DDX11 promotes HCC growth by activating PI3K/AKT/mTOR pathway.
a GSVA analysis showed that PI3K/AKT/mTOR pathway in tumor with DDX11-high expression compared with those with DDX11-low expression was identified as the top three activated regulated pathways in TCGA HCC cohort. b–d GSEA analysis the enrichment of the PI3K/AKT/mTOR signaling pathway genes with different DDX11 expression. e Expression levels of PI3K, p-PI3K(Tyr458), Akt, p-Akt (Ser473), mTOR, and p-mTOR (Ser2448) in SMMC7721 transfected with NC siRNA & DMSO (gray), NC siRNA & LY294002 (pink), DDX11 siRNA & DMSO (green) or DDX11 siRNA & LY294002 (brown) were analyzed by western blot. f Expression levels of PI3K, p-PI3K(Tyr458), Akt, p-Akt (Ser473), mTOR, and p-mTOR (Ser2448) in SMMC7721 transfected with NC plasmid & DMSO (gray), DDX11 plasmid & DMSO (pink), NC plasmid & LY294002 (green) or DDX11 plasmid & LY294002 (brown) were analyzed by western blot. The representative result of at least three independent experiments was shown. g IHC staining of Ki-67, p-PI3K, p-AKT, and p-mTOR in tumor tissues from subcutaneous transplanted tumor model. h–i Representative IHC staining of DDX11 and p-mTOR or p-AKT in HCC tissues from ZZU cohort and quantification of DDX11 staining scores in HCC patients from ZZU cohort with different p-mTOR or p-AKT expression. Scale bars, 50 μm. *p < 0.05, **p < 0.01, ***p < 0.001.

