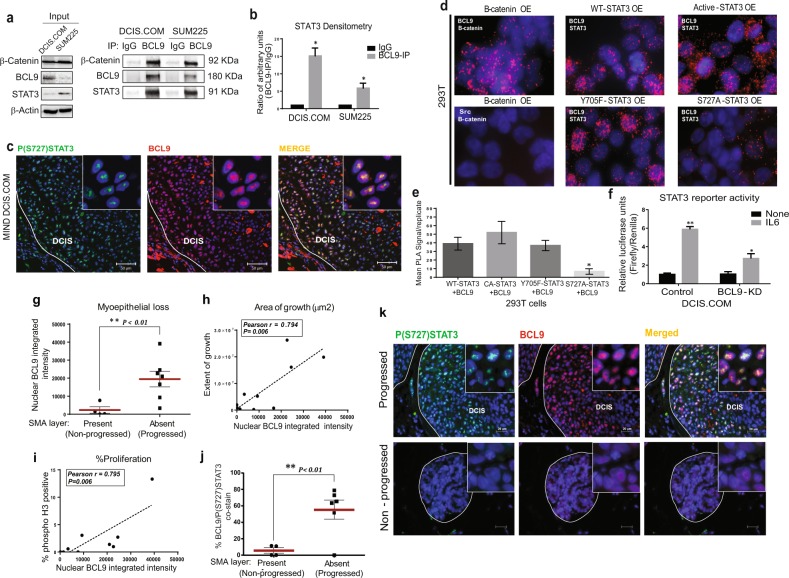
Fig. 1. BCL9/STAT3 nuclear co-expression in DCIS MIND xenografts was associated with DCIS invasive progression.
a Whole-cell extracts of DCIS.COM and SUM225 cells were immunoprecipitated using an anti-BCL9 antibody, followed by western blot analysis using anti-β-catenin, anti-BCL9, anti-STAT3 and control IgG antibodies. b Densitometry analysis of STAT3 protein in BCL9 pull-down normalized to IgG control in DCIS.COM and SUM225 cells (n = 3, *P < 0.05). c Representative IF images of DCIS.COM MIND xenografts 8 weeks post-intraductal injection. Staining represents P(S727) STAT3 (green), BCL9 (red), and Hoechst (blue). Areas of colocalization of BCL9 and P(S727) STAT3 in the merged image shown in yellow. d PLA using Duolink® PLA kit in 293 T cells transfected with BCL9 overexpression (OE) and either β-catenin, or wild-type (WT)-STAT3, constitutively active (CA)-STAT3, mutant Y705F-STAT3, mutant S727A-STAT3. The antibodies used are indicated in each panel. Anti-β-catenin and anti-BCL9 antibodies were used as PLA-positive controls. Src and β-catenin antibodies were used for PLA-negative control. PLA signals are detected by fluorescence microscopy and appear as red discrete spots. e Bar graphs represent quantification of PLA signals in three biological replicates. PLA signals were analyzed using NIS Elements Analysis Software. f STAT3 reporter assay in BCL9-knockdown (KD) DCIS.COM with and without IL6 stimulation. Data were analyzed using unpaired t-test multi-group comparison (asterisk represents a statistically significant difference; P < 0.05; n = 3 replicates per group). g Whisker plots represent distribution of nuclear BCL9 expression in Patient-derived (PDX) DCIS MIND xenografts that showed invasive progression (n = 7) vs. those that remained non-invasive (n = 4). h, i Pearson correlation between nuclear BCL9 expression and extent of growth (h) or proliferation rate (i) in PDX DCIS MIND xenografts (n = 9). j Whisker plots representing the distribution of nuclear BCL9-P (S727) STAT3 co-expression in progressed (n = 6) vs. non-progressed (n = 4) PDX DCIS MIND xenografts (asterisk represents statistically significant difference in mean values; P < 0.05). k Representative IF images of nuclear BCL9 (red) and P(S727) STAT3 (green) expression and their expression (yellow) in progressed vs. non-progressed primary DCIS MIND xenografts. Data are presented as mean ± SEM.

