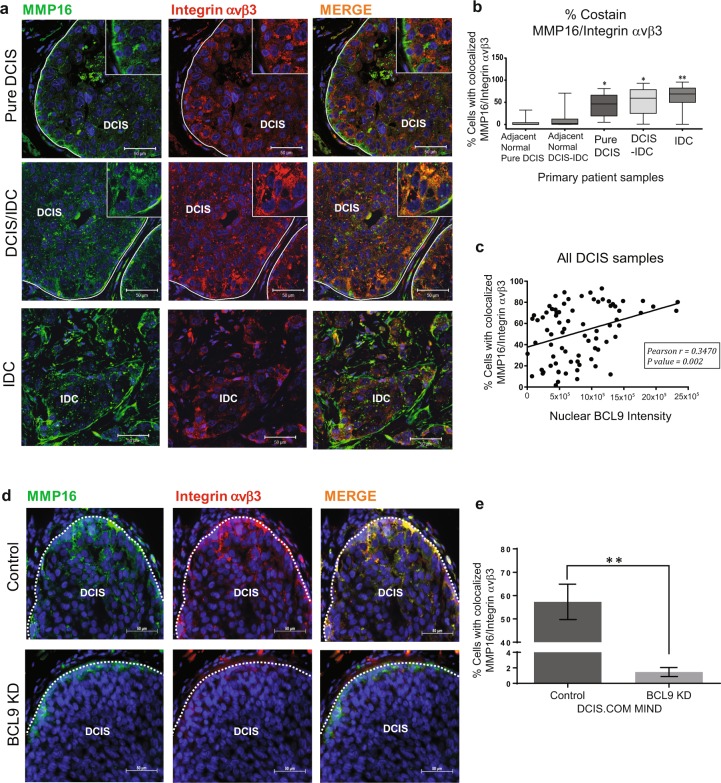
Fig. 5. DCIS malignant progression correlates with Integrin αvβ3-MMP16 co-expression and nuclear BCL9 in DCIS.
a Representative IF images of primary patients TMA sections stained with MMP16 (green), integrin αVβ3 (red), and Hoechst (blue) show colocalization of MMP16 and integrin αVβ3 (yellow areas) in DCIS and DCIS/IDC lesions. Scale bars = 50 μm. b Representative box plots of % αVβ3-MMP16 co-staining on TMA tissues. The box plots represent means and the bars represent standard error of the mean. The groups include DCIS in pure DCIS cases, DCIS component and IDC component in DCIS/IDC cases as well as normal adjacent tissues. c Scatter plot analyzing a correlation between αVβ3-MMP16 co-expression and nuclear BCL9 in DCIS lesions (n = 78). Pearson correlation = 0.3470, P < 0.05. d Representative IF images of DCIS.COM Control and BCL9 KD MIND xenografts stained with anti-MMP16 (green), anti-integrin αVβ3 (red), and Hoechst (blue) show colocalization of MMP16 and integrin αVβ3 (yellow areas) in the DCIS lesions in control (top row) and loss of expression as well as colocalization in BCL9 KD (bottom row). Scale bars = 50 μm. e Bar graph represents % αVβ3-MMP16 co-staining in control and BCL9 KD MIND xenografts. Data are presented as mean ± SEM. Data were analyzed using unpaired two-tailed t-test comparison (double asterisks represent statistically significant difference; P < 0.01; n = 3 replicates per group).

