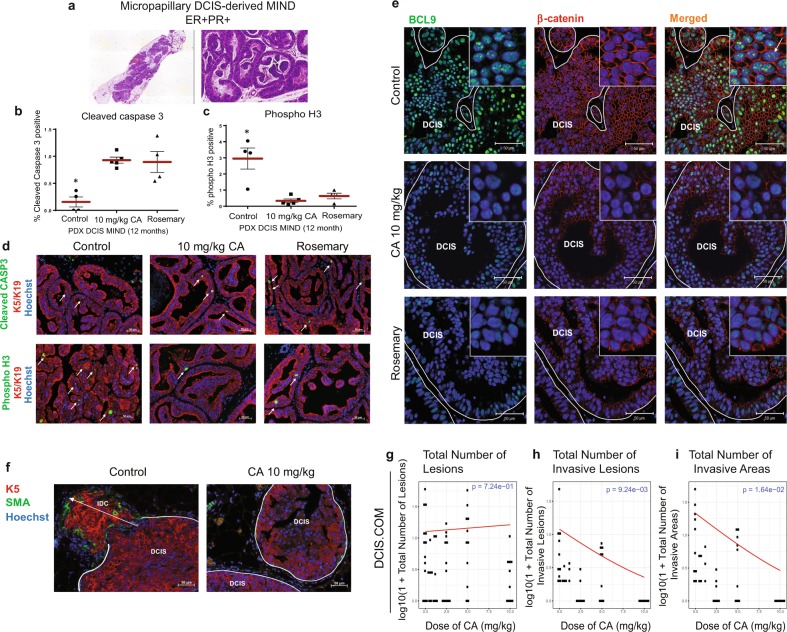
Fig. 6. Administration of Rosemary extract and its major ingredient, carnosic acid (CA), to DCIS MIND animals resulted in a significant inhibition in DCIS progression.
DCIS MIND xenografts were generated by intraductal injection of patient DCIS epithelial cells obtained from surgical and/or biopsy samples. Twelve months post-transplantation, DCIS MIND xenografts were assigned to three groups: Pretreatment control (n = 3), CA-treated at 10 mg/kg/day (n = 3), and rosemary extract treated (n = 3) (20% CA: equivalent to CA at 10 mg/kg/day). Treatments were administered daily through oral gavage and continued for 14 days. a Scanned image of H&E on a section from a PDX DCIS MIND xenograft (left) and a ×20 zoomed image (right) demonstrating the formation of micropapillary DCIS lesions in xenografts resembling the original patient’s histopathology. b, c Whisker plots depicting the distribution of cells expressing cleaved caspase 3 (b) and phospho-H3 (c) in CA, and rosemary extract treated DCIS xenografts compared to pretreatment controls. Data were analyzed using unpaired t-test with multi-group comparison (*represent statistically significant difference; P < 0.05; n = 4–5 replicates per group). d Representative IF staining of cleaved caspase 3 (CASP3) (top; green), phospho-H3 (bottom; green), human specific keratins (K5 and 19) (red) and Hoechst (blue) in control, CA and rosemary treated PDX DCIS MIND xenografts. White arrows point to positive cells. e IF staining of β-catenin (red), BCL9 (green), and Hoechst in control, CA and rosemary treated PDX DCIS MIND xenografts showing decreased intensity of nuclear β-catenin and BCL9 in the DCIS cells from CA and rosemary treated xenografts. f Representative IF images of CA-treated DCIS.COM MIND xenografts, with K5 (red), smooth muscle actin (SMA) (green), and Hoechst. g–i Plots of log-transformed number of lesions (g), invasive lesions (h), and invasive areas (i), in DCIS.COM MIND xenografts treated with CA or vehicle control. The red lines indicate the response predicted by our models for each dosage (n = 4–9, P < 0.05 for h and i). Data are presented as mean ± SEM.

