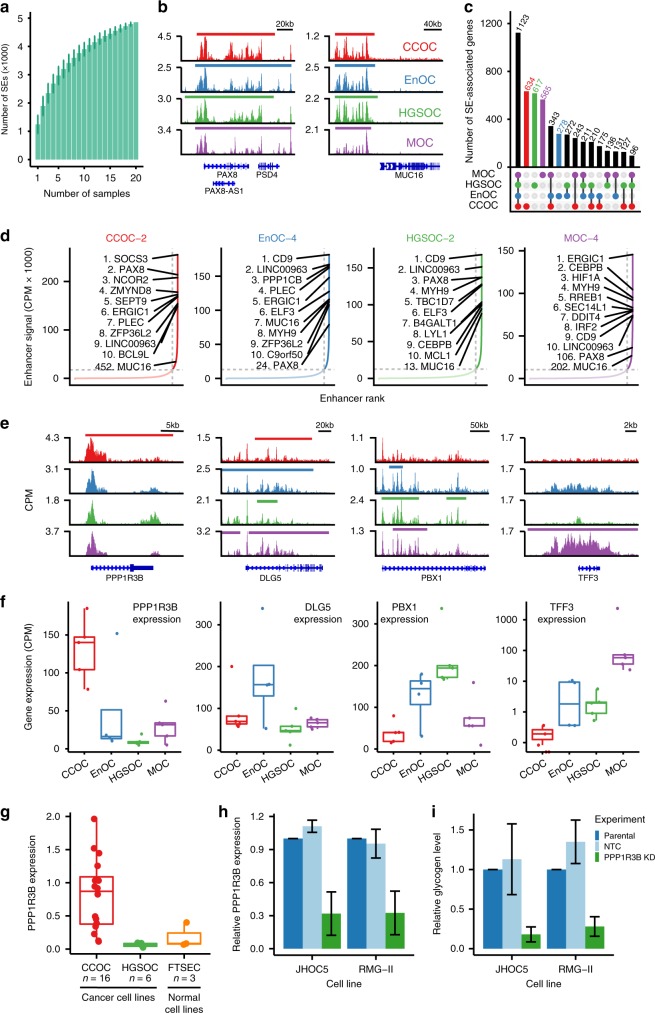
Fig. 2. Histotype-specific super-enhancers.
a Number of super-enhancers as a function of number of samples. b PAX8 and MUC16 loci show common OC SEs. c UpsetR plot showing the size of the all the subsets of super-enhancer associated genes by whether they are present in CCOC, EnOC, HGSOC, and MOC. d Plots of all enhancers ranked by enhancer signal for four representative OC samples, one for each histotype, showing the top 10 SEAGs, and the rank of PAX8 SE, MUC16 SE, and EPCAM SE for each sample. e and f Examples of histotype-specific SEAGs. Gene tracks e and gene expression f that show one example of histotype-specific SEAGs for each histotype (PPP1R3B, DLG5, PBX1, and TFF3 for CCOC, EnOC, HGSOC, and MOC, respectively). g PPP1R3B expression in CCOC, HGSOC, and FTSEC cell lines. Relative PPP1R3B expression h and glycogen level i in JHOC5 and RMG-II cell lines before and after PPP1R3B knockdown, error bars indicate one standard deviation of the mean values from three independent experiments (performed with technical replicates).

