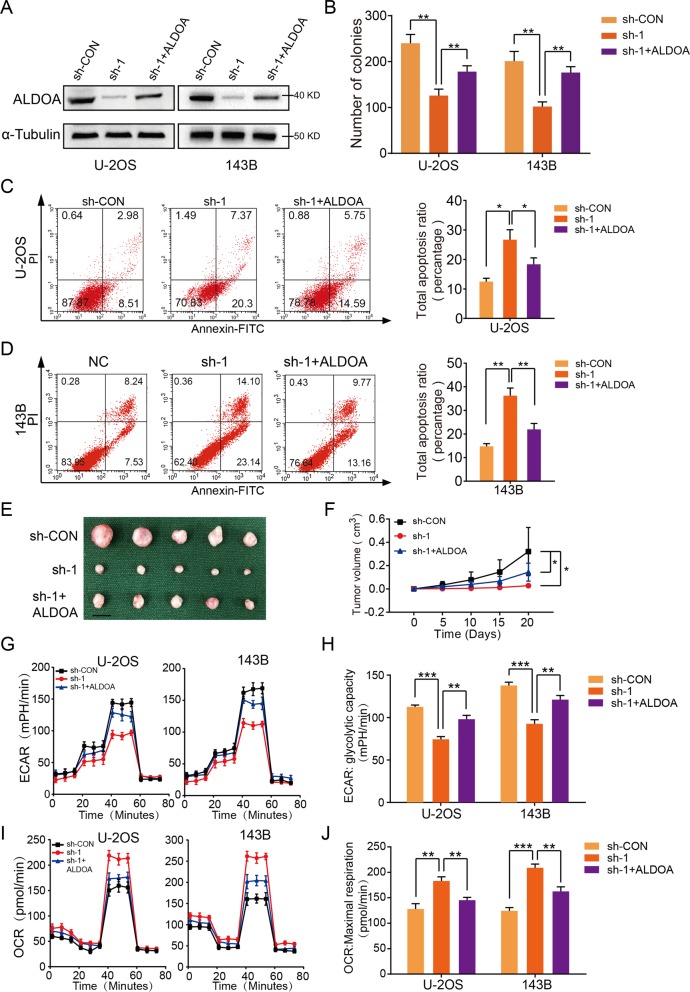
Fig. 3. KCNQ1OT1 enhanced OS growth by modulating ALDOA expression.
a Overexpression efficacy of ALDOA in sh-KCNQ1OT1 OS cells (U-2OS and 143B) was detected by western blotting. b Overexpression of ALDOA partly reversed the suppressed effects of KCNQ1OT1-knockdown on the colony formation capability of U-2OS and 143B cells, values are means ± SD, **p < 0.01 (Student’s t-test). c and d Overexpression of ALDOA partly reversed the induced effect of KCNQ1OT1-knockdown on the apoptosis of OS cells (U-2OS and 143B). Values are means ± SD, *p < 0.05, **p < 0.01 (Student’s t-test). e Morphologic characteristics of the xenograft tumors from U-2OS/sh-Control group, U-2OS/sh-KCNQ1OT1 group and U-2OS/sh-KCNQ1OT1 + ALDOA group (n = 5). Scale bars = 1 cm. f Overexpression of ALDOA partly rescued the inhibitory effects of KCNQ1OT1-knockdown on the growth rate of U-2OS cells in vivo. The volumes of tumors were measured every 5 days; values are means ± SD, *p < 0.05 (Student’s t-test). g The ECAR in OS cells (MNNG-HOS and U-2OS) in different groups (sh-Control, sh-KCNQ1OT1, and sh-KCNQ1OT1 + ov-ALDOA) were determined. Values are means ± SD. h Quantification of the glycolytic capacity from Fig. 3g, **p < 0.01, ***p < 0.001 (Student’s t-test). i The OCR in OS cells (U-2OS and 143B) in different groups (sh-Control, sh-KCNQ1OT1, and sh-KCNQ1OT1 + ov-ALDOA) were determined. Values are means ± SD. j Quantification of maximal respiration from the Fig. 3i, **p < 0.01, ***p < 0.001 (Student’s t-test).

