Figure 2.
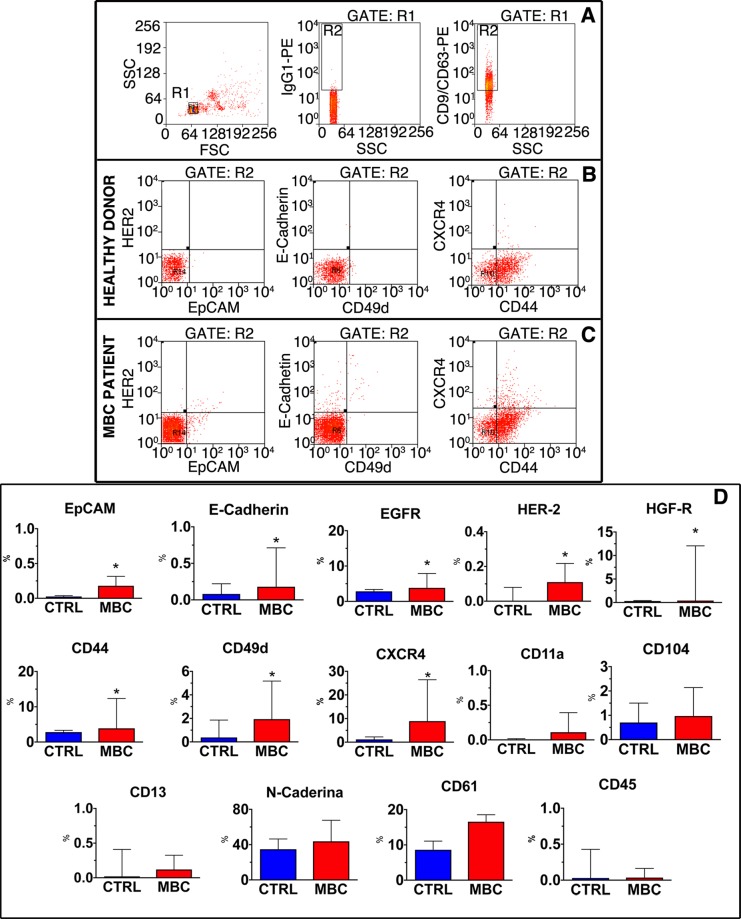
Characterization of exosomes by FACS. (A) Gating strategy. Taking advantage of beads of specific size, the gate corresponding to latex beads (gate R1) was identified in the FSC/SSC dot plot (left panel). Events included in R1 were evaluated for the positivity to the isotypic specific antibody to define the gate of positivity for the exosome specific markers CD9 and CD63 (central panel). Exosome-positive beads were therefore included in the R2 gate (right panel). (B,C) Exosome characterization. Representative dot plots defining the fraction of exosome-positive beads expressing HER2, Epcam (left panels), E-Cadherin, CD49d (central panels), CXCR4 and CD44 (right panels) in healthy donors (B) and MBC patients (C). (D) Quantitative analysis. Data, obtained from the analysis of 20 healthy donors (CTRL) and 20 MBC patients (MBC), are presented as Box and whisker plot. *p < 0.05 vs. CTRL.

