
Figure 6.
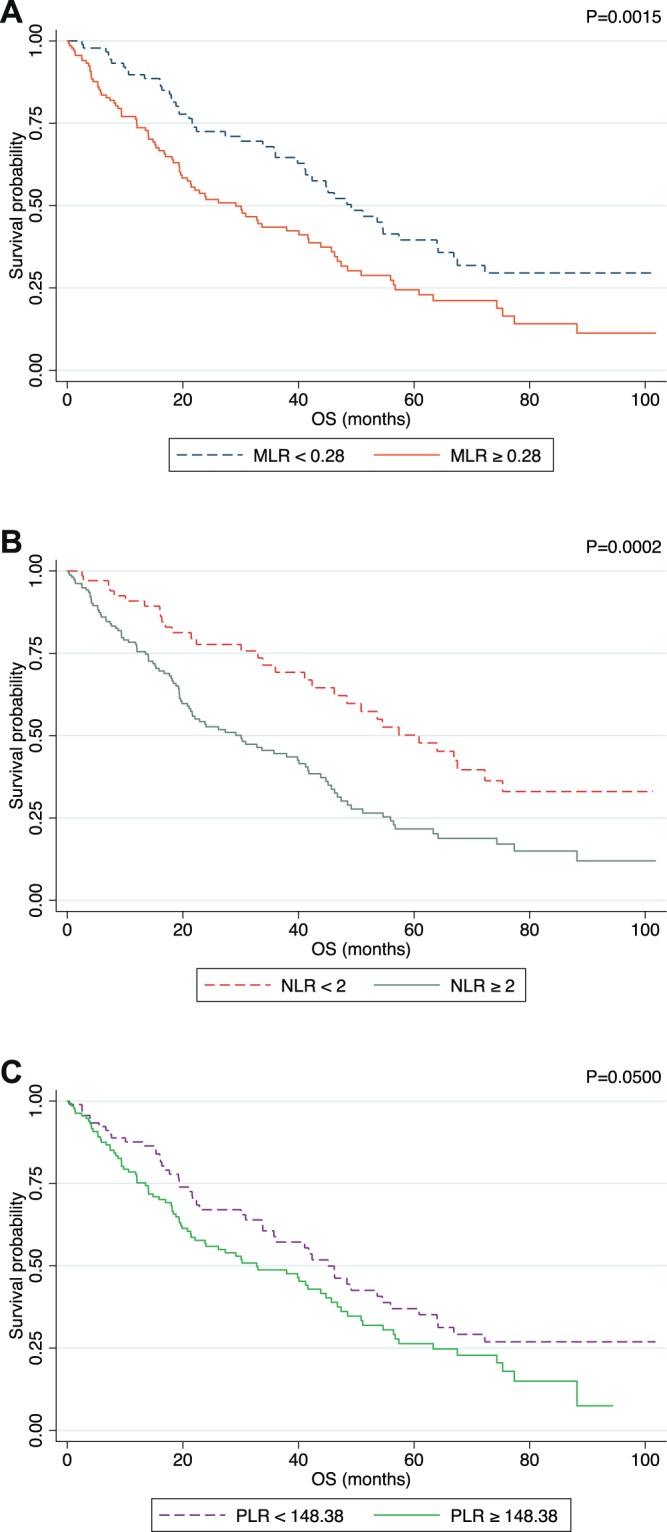
Kaplan Meier plot in terms of OS after applying the ROC Analysis defined threshold for MLR (A), NLR (B) and PLR (C). P value was calculated though log-rank test.
Official websites use .gov
A
.gov website belongs to an official
government organization in the United States.
Secure .gov websites use HTTPS
A lock (
) or https:// means you've safely
connected to the .gov website. Share sensitive
information only on official, secure websites.
Kaplan Meier plot in terms of OS after applying the ROC Analysis defined threshold for MLR (A), NLR (B) and PLR (C). P value was calculated though log-rank test.