Figure 1.
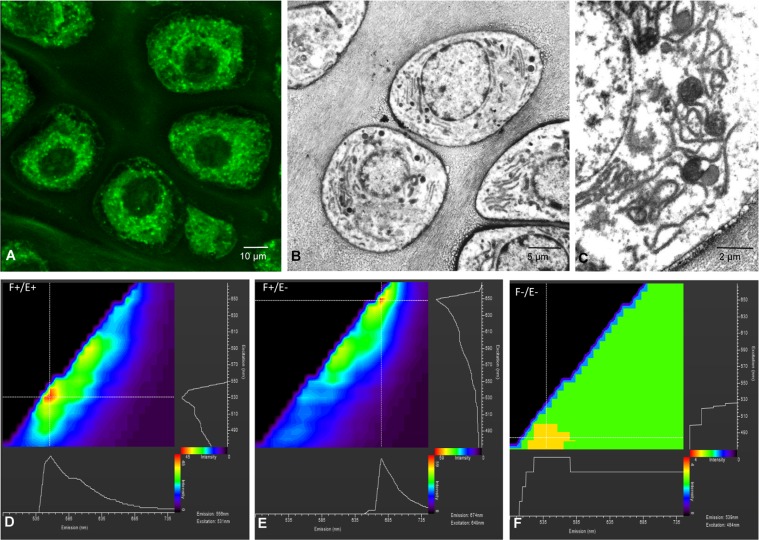
(A) Confocal micrograph of a single optical section 10 µm from the surface of the block showing prehypertrophic chondrocytes with fluorescent labelling in form of a reticular network around the nucleus. (B,C) are transmission electron micrographs of prehypertrophic chondrocytes with rough endoplasmic reticulum, scattered mitochondria and some lipid droplets. A correspondence is found between the fluorescent labelling and the Intracellular organelles viewed with the electron microscopy. (D–F) are excitation-emission maps of a positive sample (F+/E+) and two control samples for background fluorescence: F+/E−, fixed non-eosin stained; F−/E−, non-fixed and non-eosin stained. The map of F+/E+ shows a broad range of effective excitation wavelengths and peaks in intensity at excitation/emission wavelengths of 531/556 nm. The map of F+/E− shows a significant decrease of fluorescence and the excitation/emission peak is found at 649/674 nm. Native autofluorescence due to the intrinsic components of the chondrocytes (F−/E−) was low. Color scale bar represents fluorescence intensity in arbitrary units.

