Figure 6.
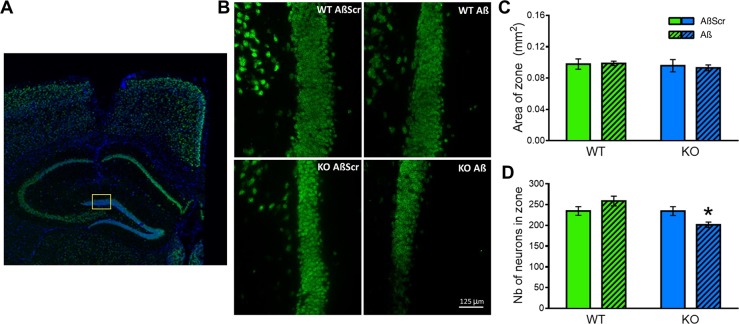
NLGN1 absence induces neuronal loss after Aβo1-42 exposure. (A) Representative IF images of NeuN staining (green) in the full hippocampus. The approximate location of the counting area is indicated by the yellow rectangle. Magnification 2.5X. (B) Representative IF images of NeuN staining (green) in the DG, where neuron counting was conducted. One image per group is showing approximately the same position within the DG. Magnification 40X. (C) Quantification of the area covered by the counting zone, which did not significantly differ between groups (two-way ANOVA Genotype main effect: F1,20 = 0.6, p = 0.4; Treatment main effect: F1,20 = 0.1 p = 0.8; Genotype-by-Treatment interaction: F1,20 = 0.2, p = 0.7). (D) Number of NeuN-marked cells counted in the DG target area showed a significant Genotype-by-Treatment interaction (two-way ANOVA F1,20 = 8.1, p = 0.01), with the KO Aβ group showing a significant difference in the number of immunoreactive cells in comparison to all other groups (star indicates planned comparisons). The number of mice is 6 per group.

