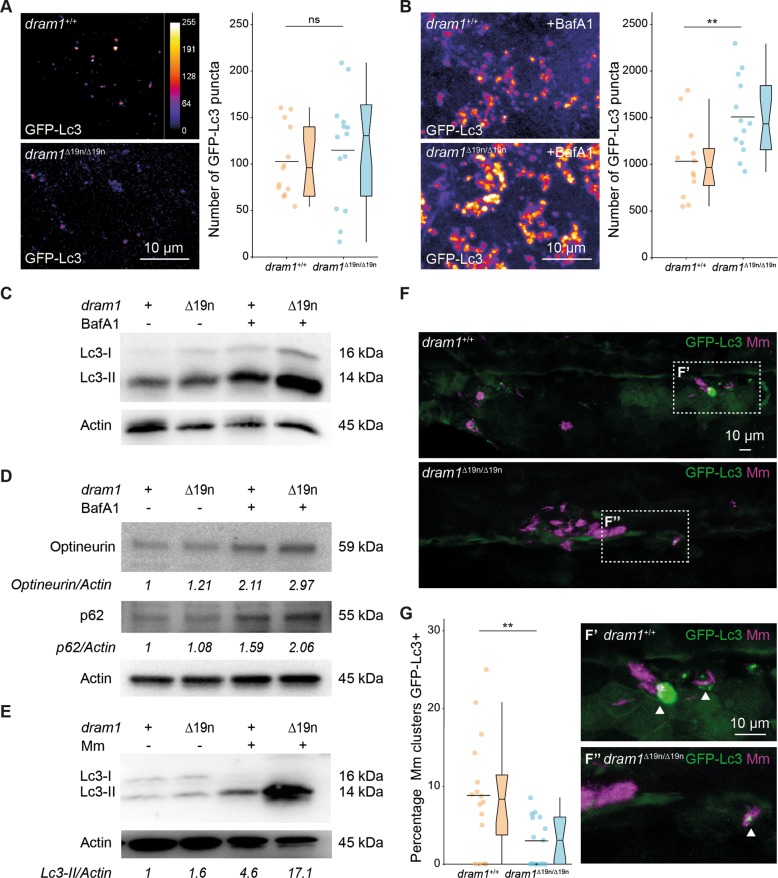
Fig. 3. Dram1 is required for GFP-Lc3 targeting to Mm clusters.
a, b Representative confocal micrographs and quantification of GFP-Lc3 puncta in dram1∆19n/∆19n and dram1+/+ larvae in an unstimulated situation (basal autophagy, a) and following BafA1 treatment b. Each larva was imaged at a pre-defined region of the tail fin (≥11 larvae/group). Results are accumulated from two independent experiments and represented by scatter and boxplots as detailed in the “Methods” section. ns non-significant, *p < 0.05,**p < 0.01,***p < 0.001. Scale bars, 10 μm. The intensity calibration bar for the Lookup table (LUT) is displayed in panel a. c–e Western blot analysis of autophagy. Protein samples were obtained from 4 dpf dram1∆19n/∆19n and dram1+/+ larvae (>10 larvae/sample). Lc3 c and e, or p62 and Optineurin d protein levels were detected in absence or presence of BafA1, c and d, or in the presence or absence of Mm e. Actin was used as a loading control. Western Blots were repeated three, c and d, or two e times with protein extracts derived from independent experiments. The Lc3II/Actin or p62/Actin and Optineurin/Actin ratio, normalized to the control sample, is indicated below the blots. f–g Representative confocal micrographs and quantification of GFP-Lc3 co-localization with Mm clusters in infected dram1∆19n/∆19n and dram1+/+ larvae. The top images f show the entire region of imaging, while the bottom images f′ and f″ show details of GFP-Lc3 colocalization of Mm clusters in dram1∆19n/∆19n and dram1+/+ larvae. The arrowheads indicate GFP-Lc3-positive Mm clusters. The data is accumulated from two independent experiments (≥15 larvae/group) and represented by scatter and boxplots as detailed in the “Methods” section. Scale bars, 10 μm.

