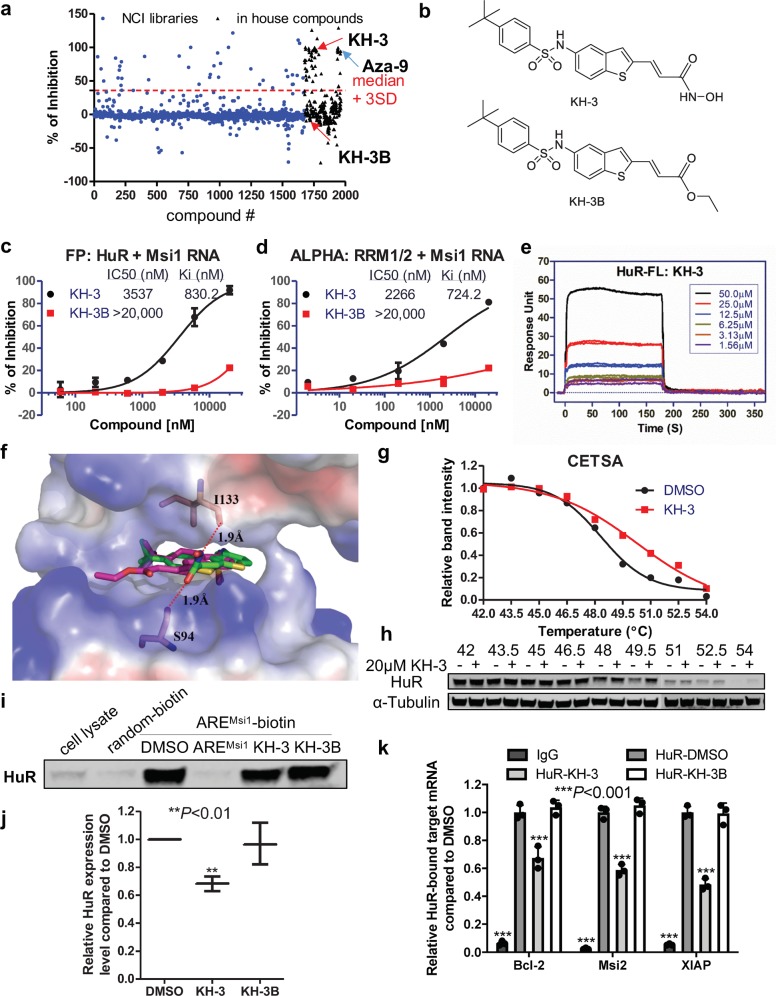
Fig. 2. Identification of KH-3 as an inhibitor of HuR–mRNA interaction.
a HTS in ∼2000 compounds from the NCI libraries and in-house compounds using FP assay. Shown here is the scattergram of compound activity expressed as % of inhibition. Median + 3 SD was used as a threshold to pick initial hits. KH-3 and Aza-9 are two top hits. KH-3B has no activity in the screening. b Chemical structures of KH-3 and KH-3B. c Dose–response curve of KH-3 and negative control KH-3B disrupting HuR–AREMsi1 binding in FP assay using 10 nM HuR protein and 2 nM fluorescein-labeled Msi1 RNA (n = 3). d Dose–response curve of KH-3 and KH-3B disrupting HuR–AREMsi1 binding in ALPHA assay using 100 nM HuR RRM1/2 protein and 25 nM biotin-labeled Msi1 RNA (n = 3). e SPR analysis of KH-3 binding to immobilized full-length HuR protein. Six doses were used and duplicated. f Computational docking of KH-3 and KH-3B to HuR RRM1/2. The protein is shown in surface representation with positive charges in blue and negative charges in red. KH-3 (green) and KH-3B (magenta) are shown in sticks. g Cellular thermal shift curves of HuR in MDA-MB-231 cells treated with DMSO or 20 μM KH-3, values are mean from two independent experiments. h Representative western blot results from one experiment. i, j Pull-down analysis of KH-3 disrupting AREMsi1 oligo binding to endogenous HuR in MDA-MB-231 cells. Random oligo is used as a negative control of the assay and unlabeled AREMsi1 oligo is used as a positive control. i Representative western blot result from one experiment. j Quantified relative HuR expression. Values are mean ± SD from n = 3 independent experiments (**P < 0.01, one-way ANOVA). k RNP IP analysis of HuR bound mRNAs affected by KH-3 in MDA-MB-231 cells. Isotype IgG is used as a negative control of HuR antibody. Values are mean ± SD from n = 3 independent experiments (***P < 0.001, two-way ANOVA).

