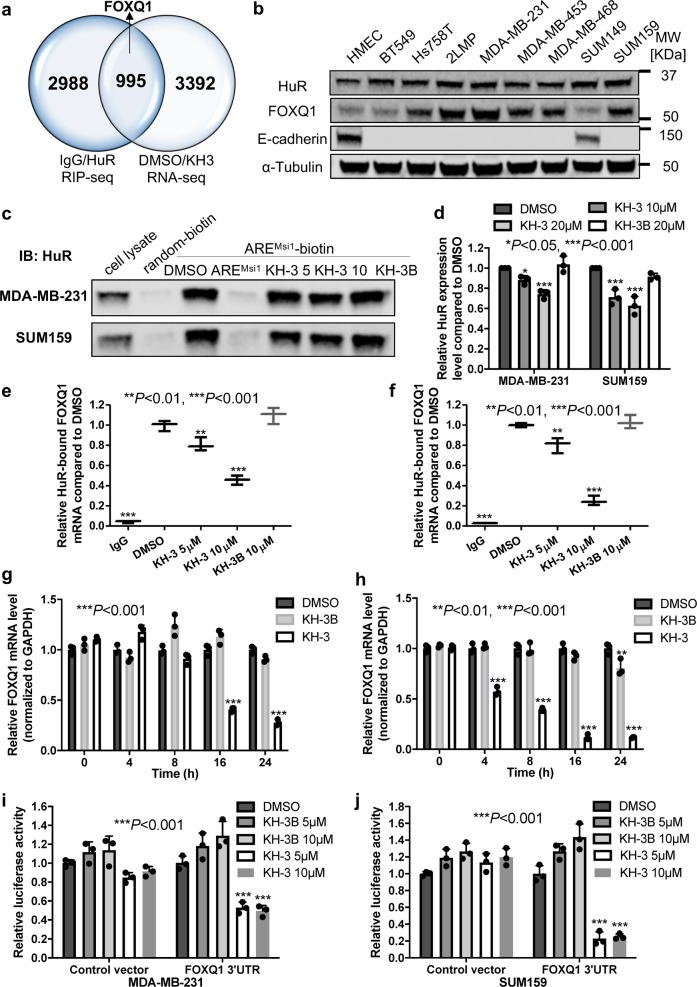
Fig. 6. FOXQ1 is a HuR target and KH-3 disrupts HuR–FOXQ1 interaction.
a Venn diagram depicting the number of targets identified in two independent RNA-seq experiments. FOXQ1 is a direct HuR target, which is also one of the top mRNAs decreased by KH-3 treatment. b Protein expression levels of HuR, FOXQ1 and E-cadherin in HMEC and a panel of TNBC cell lines. c, d Pull-down analysis of KH-3 disrupting AREFOXQ1 oligo binding to endogenous HuR in MDA-MB-231 and SUM159 cells. c Representative western blot result from one experiment. d Quantified relative HuR expression. Values are mean ± SD from n = 3 independent experiments (*P < 0.05, ***P < 0.001, one-way ANOVA). e, f RNP IP analysis of HuR bound FOXQ1 mRNA affected by KH-3 in MDA-MB-231 (e) and SUM159 (f) cells. Values are mean ± SD from three independent experiments (**P < 0.01, ***P < 0.001, one-way ANOVA). g, h Relative FOXQ1 mRNA levels in MDA-MB-231 (g) and SUM159 (h) cells treated with DMSO, KH-3 or KH-3B at the indicated time points. Values are mean ± SD from n = 3 independent experiments (***P < 0.001, two-way ANOVA). i, j FOXQ1 3′-UTR luciferase reporter assay in MDA-MB-231 (i) and SUM159 (j) cells treated by DMSO, KH-3B or KH-3. Values are mean ± SD from n = 3 independent experiments (***P < 0.001, two-way ANOVA).

